
In Data Science
Vernier Graphical Analysis is a software tool for collecting, displaying and analyzing data in real time.

Management
It helps students make important connections between abstract scientific ideas and the real world. Graphical analysis apps allow students to visualize and manipulate experimental data collected from virtually any vernier sensor.
About Vernier Graphical Analysis
Professional Features Teachers Love
Unlock key features of Graphical Analysis Pro and leverage Vernier sensors to deepen and extend your learning. With access to Pro, you can enrich your live classes and give students more ways to interact and analyze data outside of class.
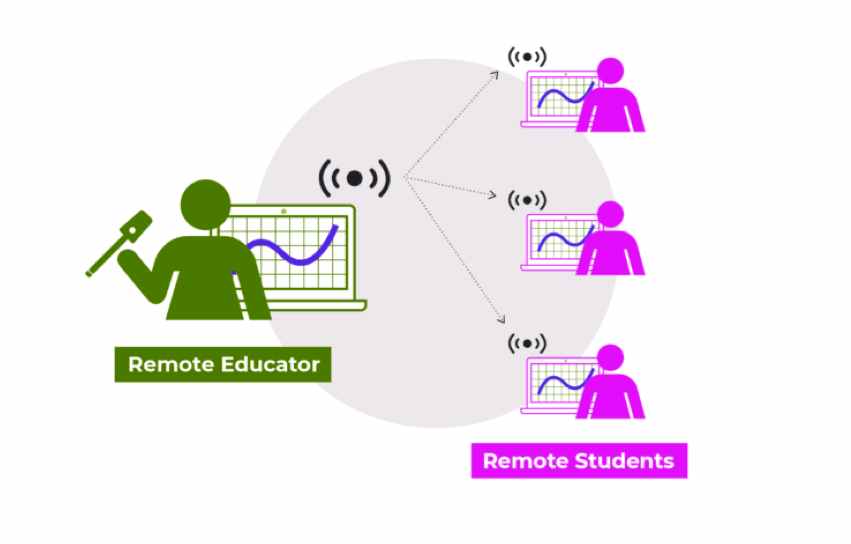
Live Data Sharing
Vernier Graphical Analysis software
Increase student engagement during live demonstrations by sharing your experiment data with students' personal devices—great for in-person and remote learning!
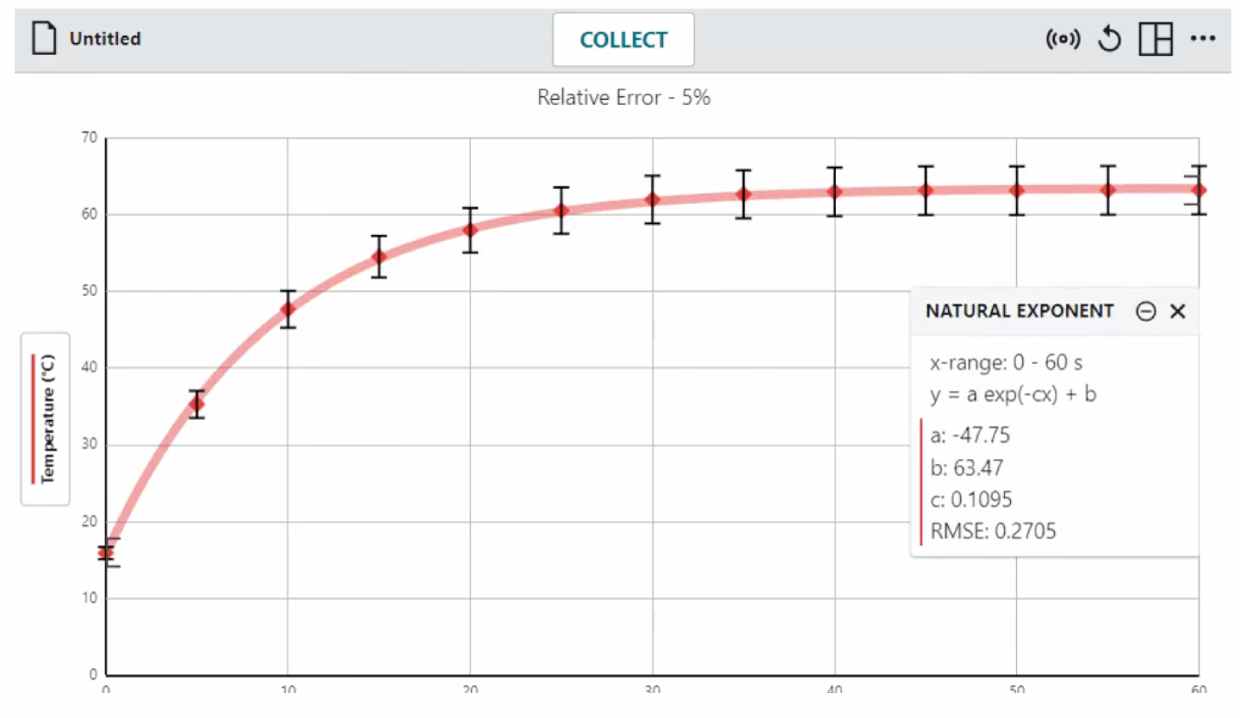
Advanced Data Display and Analysis
Data Display and Analysis in Vernier Graphical Analysis software
Create bar graphs, histograms, and FFTs. Plus, generate user-defined curve fits, understand the reliability of fitted parameters, use error bars to describe measurement uncertainty, strikethrough unwanted data, plot categorical items, and more for advanced data analysis.
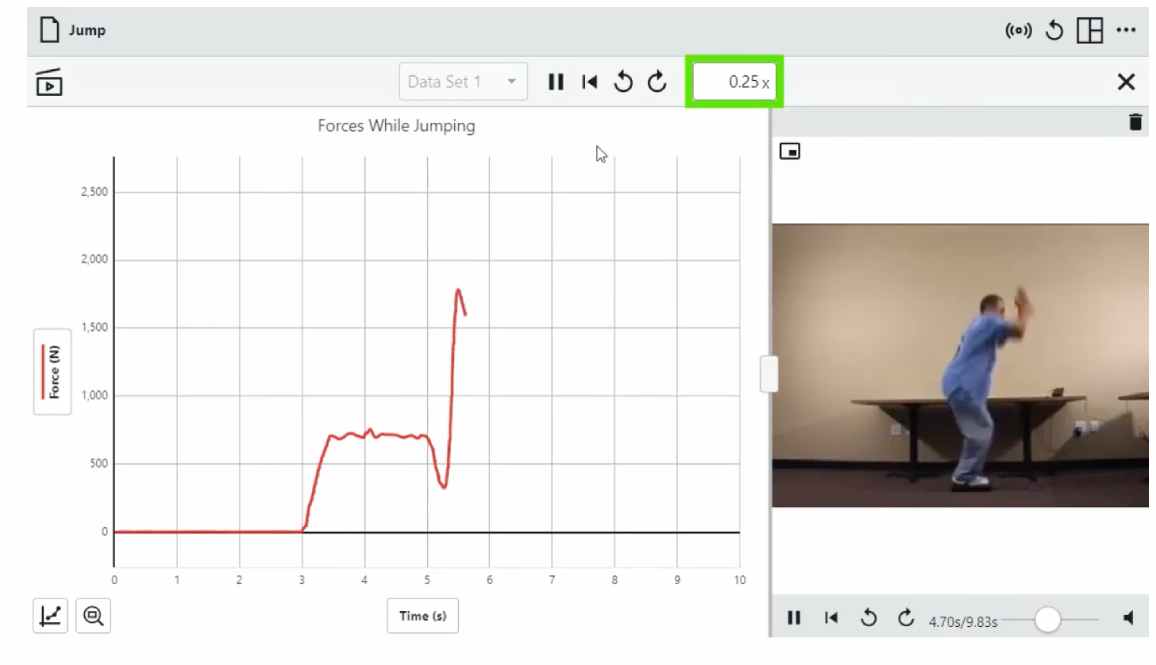
Synchronized Video and Data Playback
Synchronized Video and Data Playback in Vernier Graphical Analysis software
Increase comprehension by giving students the ability to replay, speed up, slow down, and pause recorded experiments, crystallizing the connection between what they see and the data they record.
Easy Event Marking
Mark important events—such as when melting begins and ends or when the pH indicator changes color—with just one click.
Ready-to-Analyze Experiment Library
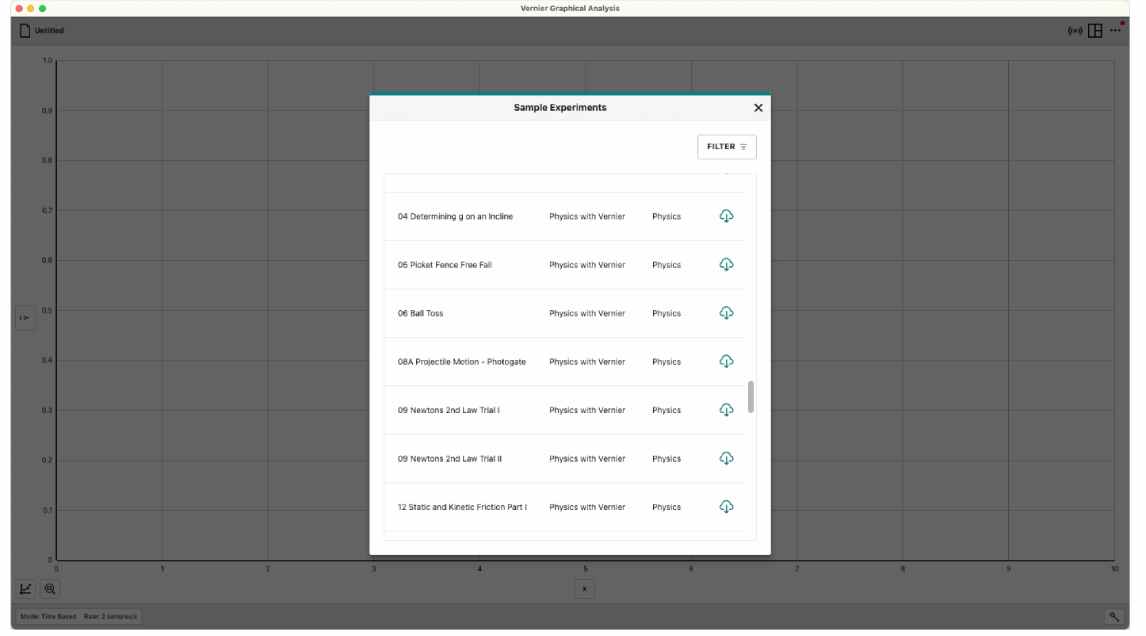
Experiment Library in Vernier Graphical Analysis software
Gain access to a library of over 45 sample experiments—each with step-by-step instructions, a video of the experiment, the actual data collected in the video, and a manual that provides meaningful context. Use the lab data for student analysis as prep work, as a makeup assignment, or to deepen students' understanding of a scientific concept, even when the needed lab equipment is unavailable.
How to unlock Vernier Graphical Analysis?
Setup is quick, easy and streamlined. Simply download Graphical Analysis, connect it to your Vernier sensor, and start collecting experimental data in seconds! Graphical Analysis runs on all operating systems commonly used in today's classrooms, so students can be used anywhere, on almost any device.
Want to enable advanced data analytics, better support remote learners, and improve the learning experience? Unlock Pro features at any time after completing your purchase. A splash screen appears in the graphical analysis. At the bottom of the screen there is a field to enter your activation key. Type or paste your key into this field and click Submit.
Vernier Graphic Analysis 4
The new version of the free software Graphical Analysis 4 is now available for all popular platforms: Chrome, iOS, Android, Windows and macOS. Specifically designed to work with master and wireless sensors to make it easy for students to demonstrate lab work.
Conventional sensors
Use Graphical Analysis 4 with most Vernier sensors by connecting them to lab interfaces: LabQuest 2, LabQuest Stream or LabQuest Mini.
Go Direct sensors
More possibilities for graphical analysis 4 with wireless sensors - the range of sensors continues to expand. Connect via Bluetooth or USB if desired.
Sharing data
Students can work in groups using LabQuest2 or Logger Pro 3. Each device will get its own copy of the data for practical work, for the same conditions.
Key features of Vernier Graphic Analysis v4
Data collection
- Collect from multiple sensors simultaneously, using an interface - e.g. LabQuest Stream, or with wireless Go Direct sensors. Use Data Sharing for all Vernier analysers.
- Delayed start based on event or time, with simultaneous recording.
- Controllable data sampling rate and experiment length.
- Data collection upon reaching an individual indicator, without the need to calibrate the sensor.
- Manual input or copy from clipboard / Change units on most sensors.
Data analysis
- Control the number of graphs on the screen by setting the scale - one or two or three at a time.
- Change coordinate axes and show graphs with a choice of lines or dots.
- Calculate statistics for all data or just the right part of it.
- Linearise individual columns of data in relation to selected sensors.
- View and highlight data in a table.
- Graphical-based interpolation and extrapolation.
Data exchange
- The instructor receives data from LabQuest 2 and the computer running Logger Pro 3, and can then easily send the data to students for processing.
- Look for patterns and learn the features of the same data to make sure each group of students is well versed in the subject and able to put the knowledge into practice.
Information storage
- Convenient mechanism of work with the results of calculations to save them (layout).
- Export from Graphic Analysis 4 data files for use in Logger Pro 3.
Technical requirements for running the Vervier Graphical Analysis 4
Windows / Chromebook / Macos
- Computer with Windows 7, 8.1 or 10.
- Chromebook running ChromeOS 49 or newer.
- Computer running macOS 10.10, 10.11, 10.12.
iOS devices - iOS 9 or newer
- iPad (4th generation or later), iPad mini, iPad Air and iPad Pro
- iPhone (5th generation or later)
- IPod touch (5th generation or newer).
Android devices - Android 4.3 or newer
Android-v 4.1-4.2.2 download Graphic Analysis v1.2 from Google Play.
- Nexus 5, 7, 10.
- Samsung Galaxy series and further.
What is graphical data analysis?
Graphical data analysis is finding results using graphs. way to think. Imagine you are looking at a new package in R and using datasets. I'm not familiar with the help examples.
What are Vernier sensors?
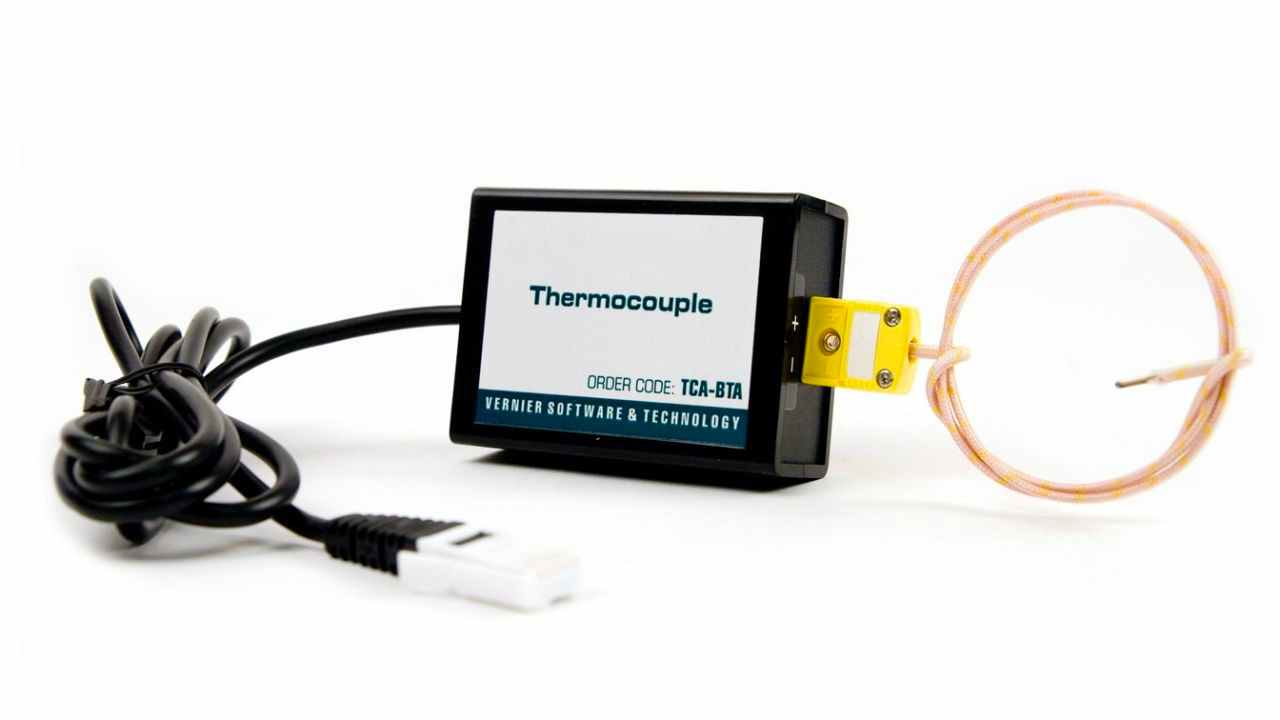
Vernier sensor for temperature measurement over a wide range
Vernier is a leader among manufacturers of sensors for measurement applications. Vernier currently builds easy-to-use and affordable interfaces, sensors and graphical analysis software. Vernier currently manufactures around 60 different sensors for measuring various physical quantities. This includes sensors for both classic measurements like temperature, force, humidity, voltage, as well as for very non-trivial measurements like ECG, heart rate, etc. In this example, we will consider interaction with a wide range temperature sensor (thermocouple). The sensor is designed to measure the temperature of various objects over a very wide temperature range (- 200 to + 1400 ºC). It can be used for research in corrosive environments that do not destroy the sensor housing.
.GA3 file extension. What is a GA3 file?
A document created and used by Graphical Analysis, an application used by middle and high school students to create, analyse and print graphs; can contain graphs, data tables, histograms, text and calculated columns. More information
Although the iOS graphing application can import most data from a GA3 file, it cannot import calculated columns from a file.
About GA3 files
Our goal is to help you understand what a file with a * .ga3 suffix is and how to open it.
Graphic Analysis 3 The document file type, file format description and Mac, Windows and iOS programs listed on this page have been individually researched and verified by the FileInfo team. We strive for 100% accuracy and only publish information about file formats that we have tested and verified.