
In Digital Marketing
Why tools like Hotjar should be connected to every online shop? In this article you'll find clear examples of how Hotjar helps get data on user behaviour and takes part in increasing a project's conversion rate. How to connect Hotjar and what functionality to use first?

Management

Hotjar is one of the top online usability analysis services that helps you study your users, get feedback and optimise your site for increased conversions. Over 350,000 organisations currently use Hotjar for usability analysis and in 2021 it was recognised as one of the leading services in EMEA. Companies such as Ryanair and Tomtom are actively using it.
The service nicely complements traditional web analytics tools such as Google Analytics and provides a more complete and clear picture of how users interact with the online shop.
Hotjar features:
- Heatmaps: maps clicks, scrolling, mouse movements;
- Feedback collection;
- A/B testing record review;
- Tracking and recording user behaviour;
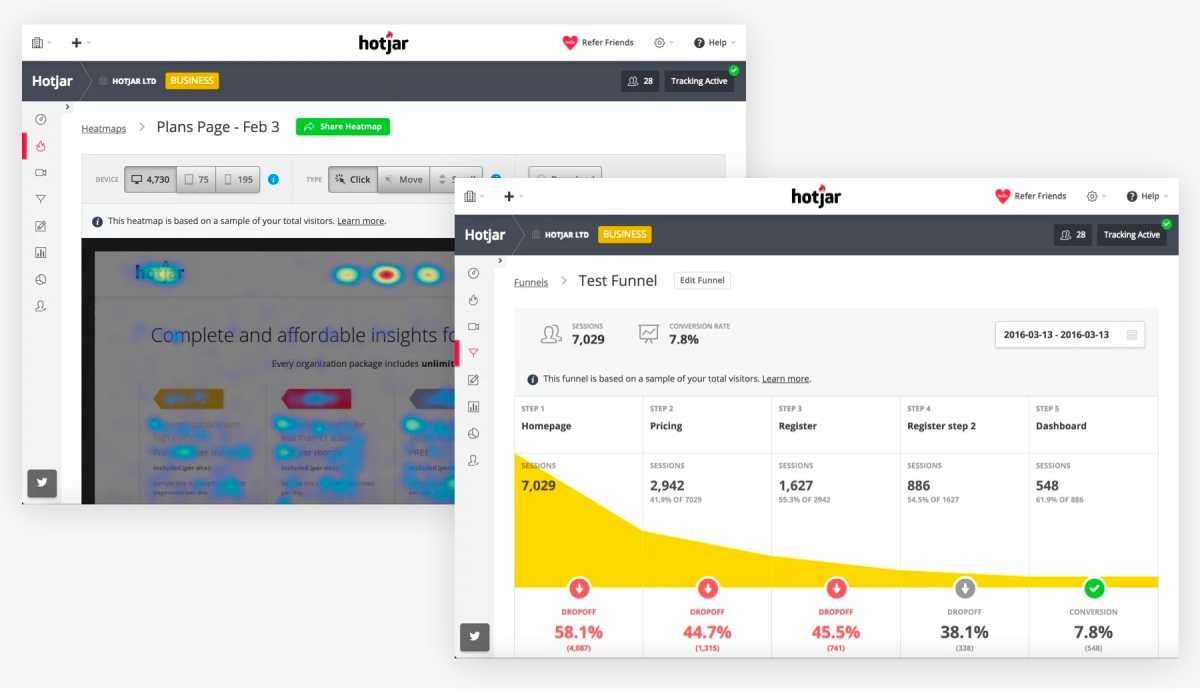
- Conversion funnel analysis;
- Forms analytics;
- Creation of various questionnaires;
- Click comparison.
Key Hotjar features with clear usage examples
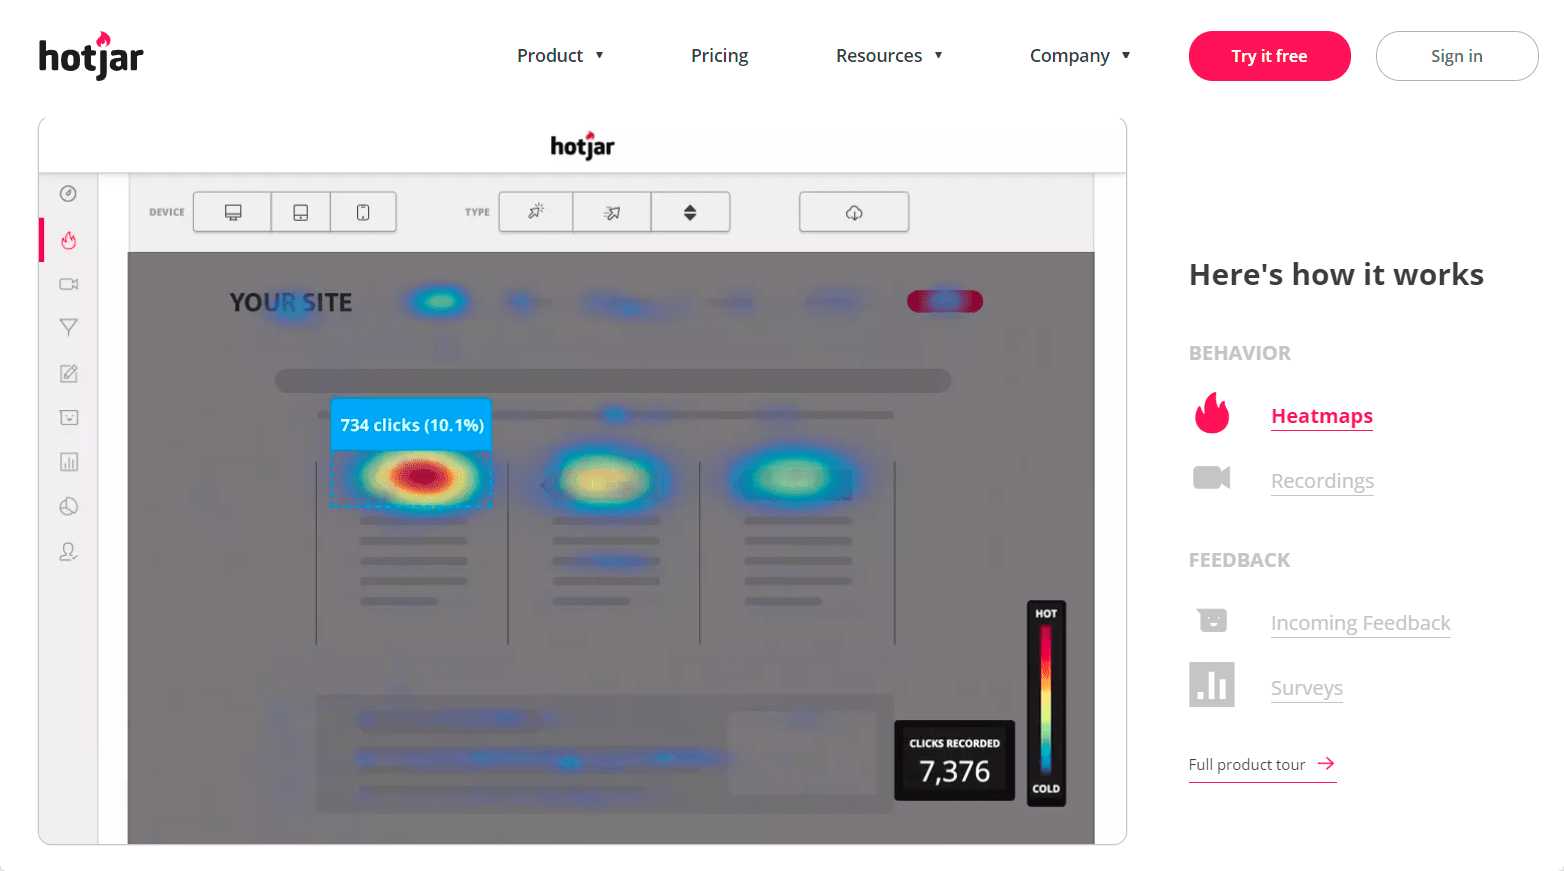
Heatmaps
There are 3 types of heatmaps that are the most popular for e-commerce projects:
- Click map;
- A scrolling map;
- A map of mouse activity;
Heatmaps allow you to mark up the required pages for tracking, i.e. you can select specific key pages or groups of pages rather than collecting data from the entire site. The required data is collected within 1-3 days, depending on the size of the project and traffic.
Click Map
A click map shows all elements and areas of pages that users click on, as well as showing the frequency of clicks.
It helps to:
- Determine the priority of design elements on the page;
- Identify elements that are not clickable but that users actively click on;
- Identify buttons or links left unchecked.
- Track non-standard behaviours and understand what's happening on the page in real-world conditions.
Click maps are particularly important for customising filtering. They allow you to see which filters are most frequently used by website visitors, and display them on product pages.
Scroll Map
A scroll map shows where your visitors are scrolling and the intensity with which they are scrolling. You can determine the degree of customer engagement and the percentage of engaged users from the total number of visitors. If key information is gathered at the bottom of the page, it's important that the user scrolls down to it.
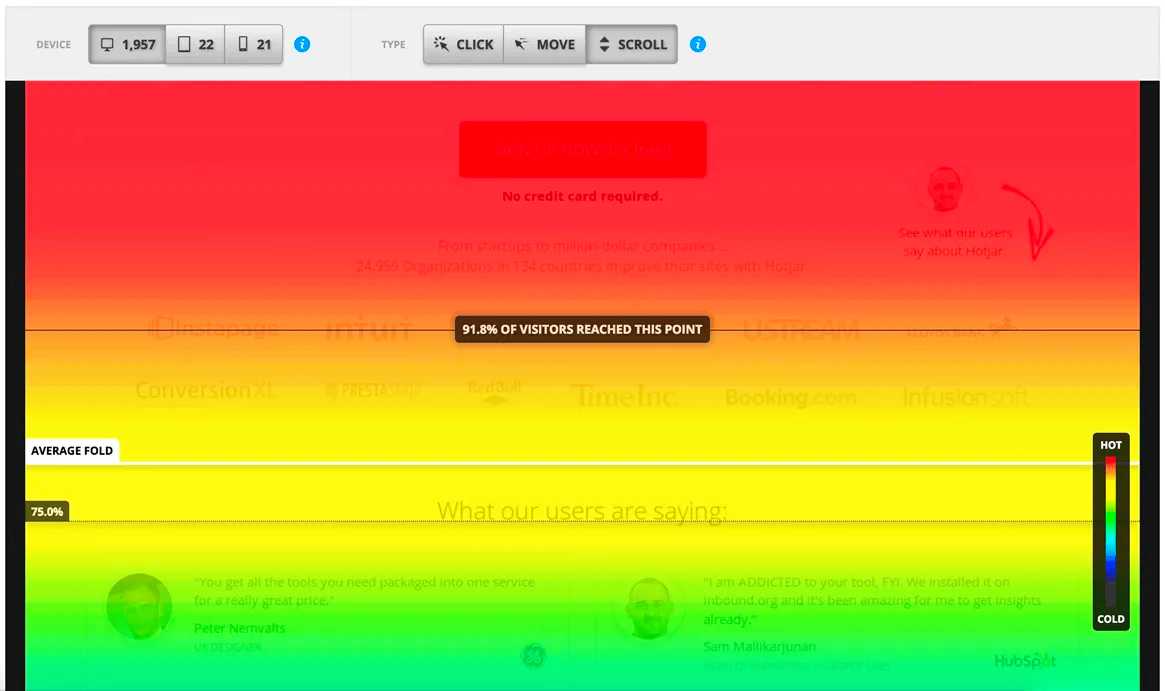
The heatmap shows that the most clickable part is in the second half of the page - the product categories, even though the scroll map shows that only 50% of users click through. So you need to raise the blocks with more clickable content higher up.
Cursor movement
Cursor movement (mouse activity map) allows you to track the points and areas on the page that the user focuses most (images, space around links, and so on). The cursor always follows the user's gaze, so it is used as an eye-tracker to understand which elements on the site most attract the user's attention and whether the site design is accentuated correctly.
In the screenshot, we can see how the cursor moves, which areas are viewed, where they try to click and where they go afterwards. The warmer it is, the longer the cursor lingers in the area. It was a revelation that people go to the cabinet to check bonuses after promotions. That is, the discounts serve as a trigger for this action.
Session records
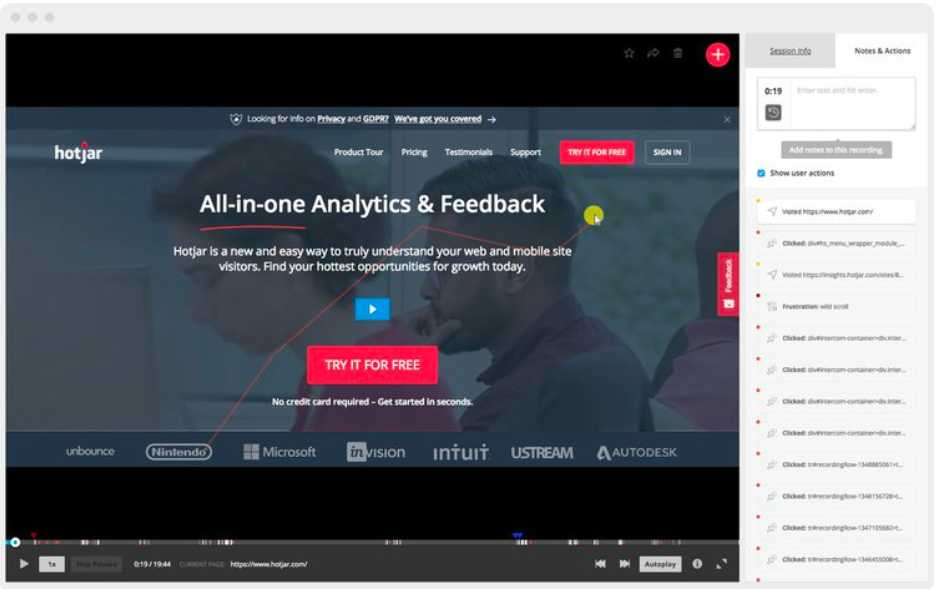
This is a fairly flexible tool for analysing the behaviour of your target audience. The recordings can be saved as favourites and shared with other team members for future work. Whereas Hotjar maps show the situation on individual pages and groups of pages, records in dynamics show a real user's interaction with the site as a whole:
- The point of entry to the site;
- Transitions from page to page;
- Whether the user enters data;
- Whether and where the user makes mistakes;
- Shows failure and exit points;
- Shows where rage clicks (where users repeatedly click or tap because they are frustrated or angry) occur, etc.
Videos can be filtered according to pages, devices, countries, etc.; Even on the free plan there are plenty of filtering options.
View records during A/B testing
With Hotjar it is possible to connect heatmaps to experiments. This helps to:
- Determine how users behave on experimental pages;
- Which option works better;
- Find points of growth;
- Determine which functionality needs tweaking, and so on.
Collecting feedback
A great unobtrusive tool to find out what seemed uncomfortable to the user when interacting with the page, and ask them to evaluate the interface. The way it looks on the site is that a small Feedback bar opens up when a user clicks on it. The user can rate the interface on a 5-point scale from the emoji and optionally leave a comment.
The appearance of such a box can be designed in the style of your site.
Questionnaires
This is one of the most significant tools for conversion optimization. We especially recommend introducing it in checkouts if the exit rate from the checkout page is inexplicably high.
For example, a small survey like this on the Intertop website helped identify the causes and was the deciding factor for a significant change in the entire funnel.
When leaving the checkout page, the user was asked "Why are you leaving the checkout?"
How do I connect Hotjar?
You can install Hotjar yourself. If you have Google Tag Manager installed, you don't even need to pull a developer for this.
Method #1
You can use integration with Google Tag Manager via Hotjar interface, just click Start Setup and follow the instructions. You need to be logged in to the Google account where your Tag Manager is created, and specify the necessary container when installing. The tag will be automatically created and you don't even have to log in to Tag Manager to publish the tag.
Method #2
Create a tag via Google Tag Manager, wich includes an ID that can be taken from your Hotjar account.
Simply find the tag you want and write the ID in it.
Method #3
You can put the code directly into Head and Body. Simply copy it from your Hotjar account and give it to the developer.
Next it's very simple, go to the right section with heatmaps, records, etc, and start tracking user behaviour.
How to interpret Hotjar data correctly?
Interface errors that lie on the surface are easy for you to spot on your own. That's the undeniable advantage of this tool. But there are situations where you should not jump to conclusions without comparing the data with analytics, without fully understanding user behaviour patterns.
For example, low scrolling depth does not always indicate a disinterested user. By comparing this data to clicks, click-throughs to other pages and crawl rate, you can conclude that scrolling depth is the norm.
This is why it is better to order a comprehensive usability audit of a website, so that even if you are fine-tuning the interface, you can at least see the problem comprehensively.
Hotjar - how to collect all the customers' pain and learn more about the problems in the interface
Everyone who works with CX, UX and UI knows, that you need to watch user session records to find problems in the developed product. We all know, that there is no way to design a perfect interface. That's why feedback directly from examples is more valuable than any annual subscription!
You can segment the way you want
Yes. You can! I exploded inside when I found this part! You don't have to go through hundreds of sessions to figure out where someone has fallen off. You can just tag the right user who behaved differently than expected.
To do this you will need to add events (just like in any analytics system GA, YM, etc.). We have configured for 6 segments so far:
- visit less than 5 seconds
- visit more than 10 seconds: opened the landing page and bounced
- got to registration and bailed bounced
- got in and dropped out.
- got registered and started using website
- excellent (who started to use the website actively).
And then just browse...
Some people are hooked on tiktok, some on Instagram, some on YouTube. You can got hooked on hotjar for the month - easily! At the stage of product formation, you need to understand what your users need - pick up that part/feature/direction and grow.
You can regularly sort out a few dozen entries that get caught in your filter. The filter is to be adjusted depending on the model of behavior you want to understand. We suggest you to take 2-3 types of errors in the user flow and analyze "How can I make this part better". After identifying a bug in a few users, you can contact them for an interview and figure out what goes wrong. When you have the answers - it's much easier to make a working prototype and test.