
In Market Research
It has been half a year since the global action on the COVID pandemic began. The lockdown, isolation and related terms are now a part of everyone’s life. Inevitably, this changed the industry of marketing, especially considering the online behavior.

Management


Table of Contents
- Customer demand, GDP and lockdown
- Recovery: digital-inspired prediction
- Migrating to Online —Finance
- Marketing & Advertising
—Job
—Food & Beverages
—Animals
—Business
—Shopping
—Realty
—Beauty & Fitness
—Entertainment
—Health
—Law & Legal
Below is the overview of the impact on business in the scope of digital marketing and online advertisement.
Customer demand, GDP and lockdown
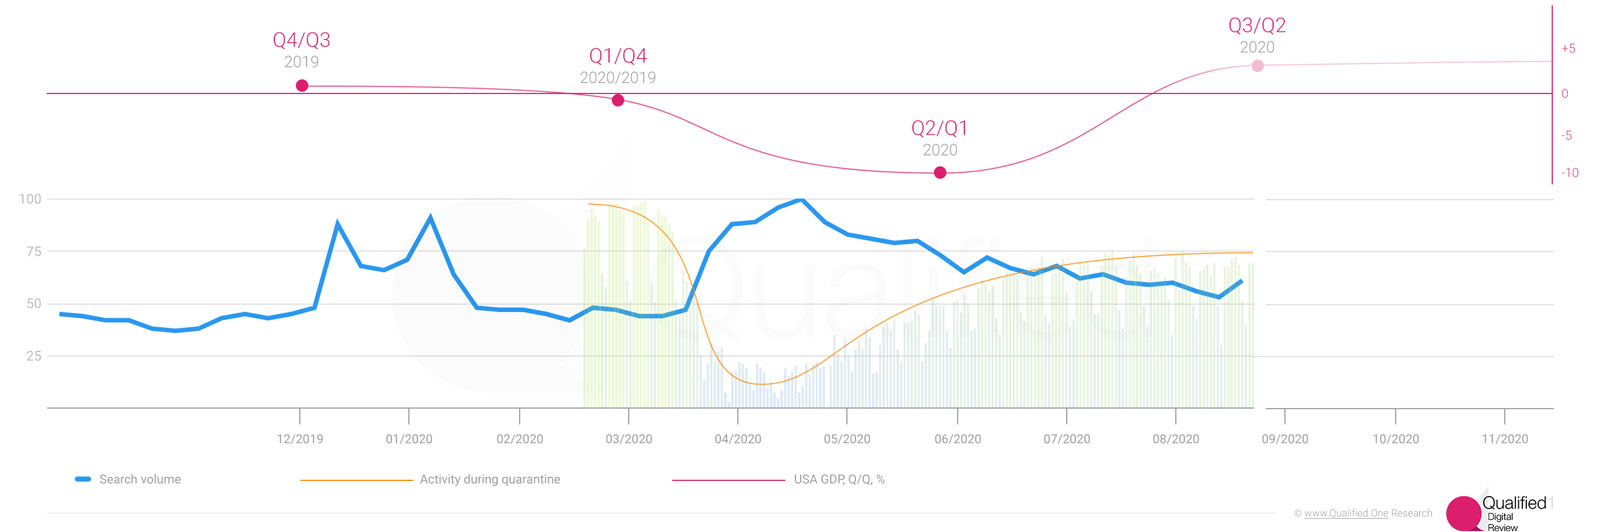
Search volume[1] associated with purchase intent, United States GDP and activity level during lockdown (New York). Sources: Google, Allianz Research, Yandex LLC, Euler Hermes
Not surprisingly, there is an obvious and direct correlation between the lockdown strength and the Gross Domestic Product value[2] (as of the United States). We also discovered that the decrease of activity curve[3] (in terms of physical movement – or, in other words, in terms of getting outdoors) is just an exact reflection of the graph that represents the dynamics of the web search volume related to purchase queries like “buy something”.
Apparently, the customer demand has partially moved to online stores but this was, of course, insufficient to keep the economic activity at the pre-COVID levels.
This is also well-illustrated by the stats of the retail store visits[4]: though it differs depending on the certain country with its epidemiological situation and restrictions, the overall picture is pretty much the same.
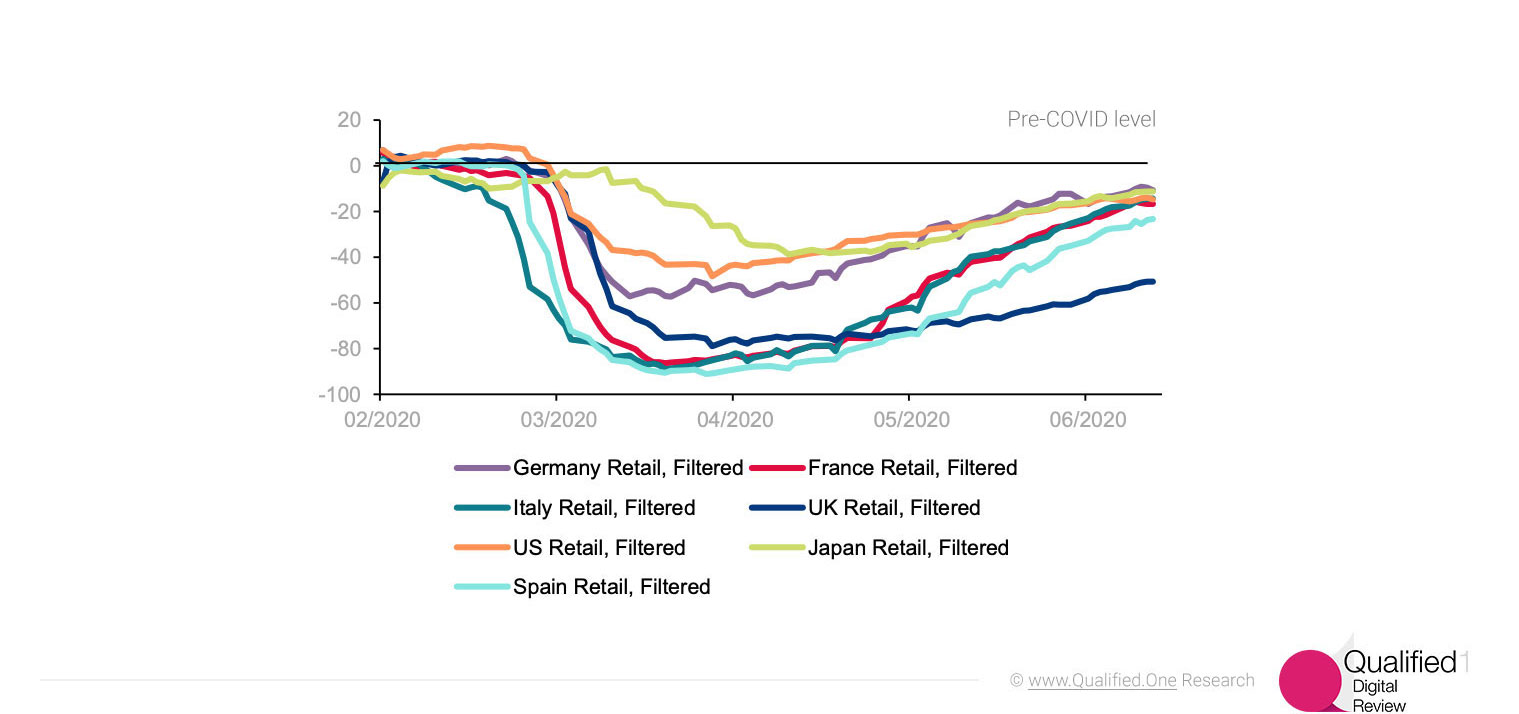
Daily Google mobility data for „Retail“, adjusted for weekends and holidays, filtered trend. Sources: Google, Allianz Research
It is worth mentioning that the services sector was affected in a much harder way[5]: you can start selling your goods online, but you can’t start doing haircuts remotely. The same is true for manufacturers with a low automation level.
Third quarter of 2020 is predicted to show the GDP growth[2] (several percent with respect to second quarter). This forecast, however, is based on a positive scenario which assumes that the pandemic in the US will gradually ease down. In case of the widely discussed “second wave” one could expect behavior similar to the March-May period: new lockdown, even if it is moderate compared to the one of spring 2020, will inevitably lead to the decrease of activity levels, GDP going down, customer demand moving to online stores. We could, roughly speaking, get back to the first virus outbreak stage.
Informational queries
An easy-to-see effect of the lockdown and pandemic is the growth of informational queries[13]. In some regions April search volume of informational queries incorporating words “how”, “why” and “what” exceeded by 1.6 times the corresponding March numbers.

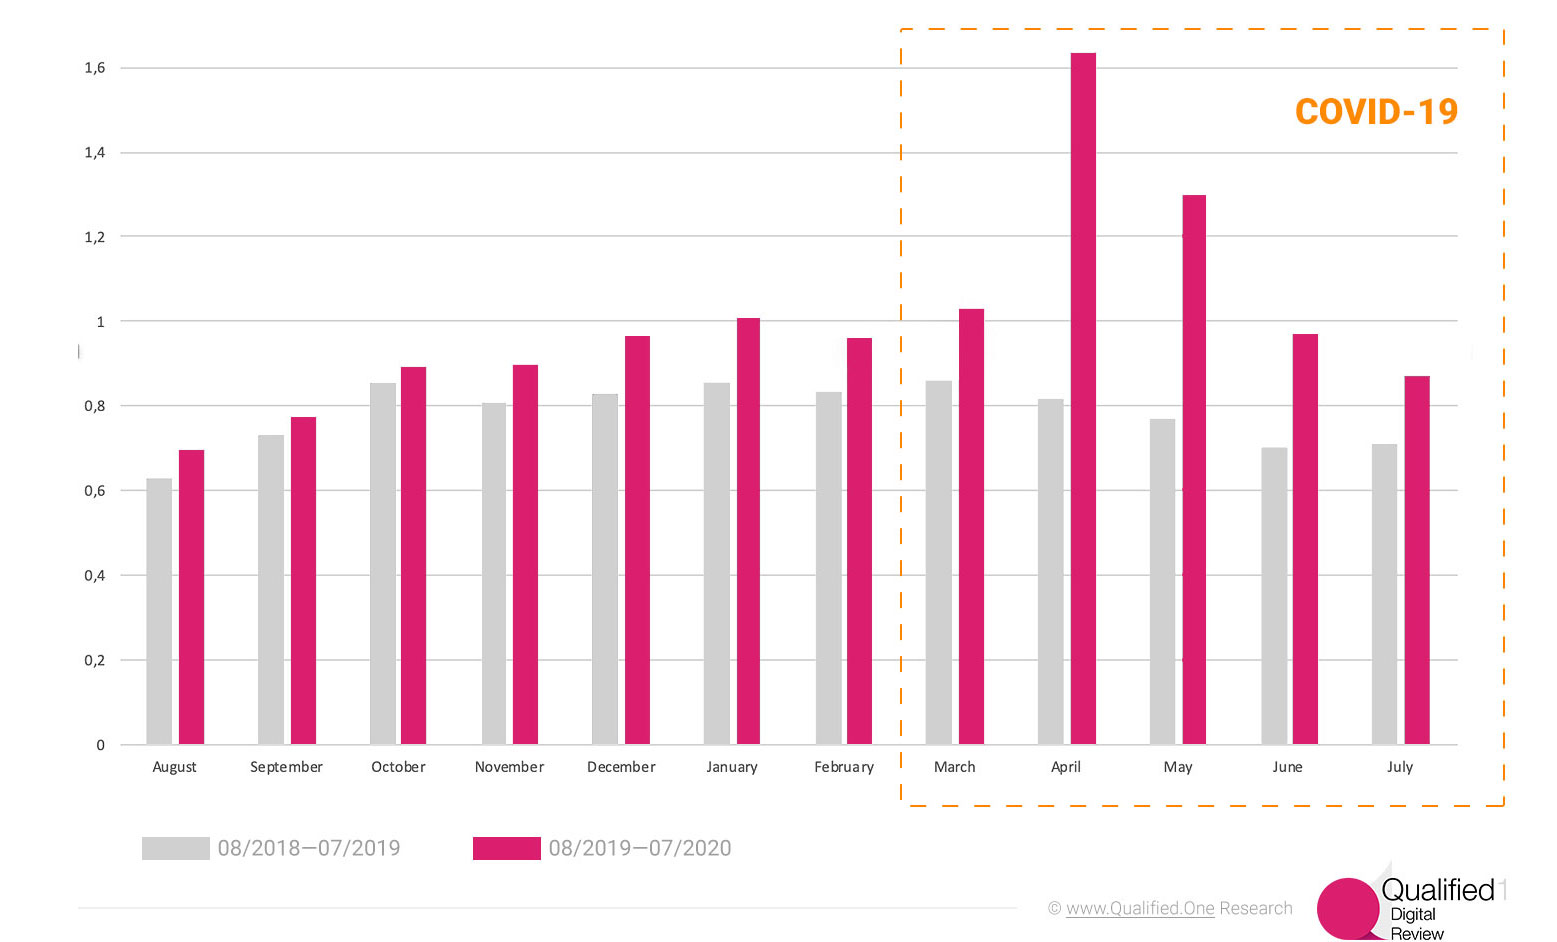
Informational queries containing words "How", "Why", "What". Web search, period since 08/2018 till 07/2020, year-to-year comparison. Source: Yandex LLC
The intrinsic structure of this search flow is a subject to inspect: presumably, the growth can be a combined effect of the COVID-related searches and the overall curiosity caused by lockdown.
Transactional queries
As for the transactional queries (that is, containing “buy”, “order” and similar words), there is no such an explosion; however, the numbers are still much greater than a year ago[3]. This is again the effect of the “migration to online” which we discuss in detail.
Transactional queries containing words "Buy", "Order". Web search, period since 08/2018 till 07/2020, year-to-year comparison. Source: Yandex LLC
Recovery: digital-inspired prediction
An interesting exercise is to make a linear extrapolation of the current recovery regime using the search engines statistics. One can see that, apart from the turbulent stage (March-June 2020), the curves representing certain search queries volume (which will be specified in what follows) are rather smooth and slowly-changing.
Isolation-induced queries: stay at home
First, let us take a look at the search queries related to staying at home. It is likely to be a good marker of the overall trend of getting back to offices and to the (relatively) normal life.
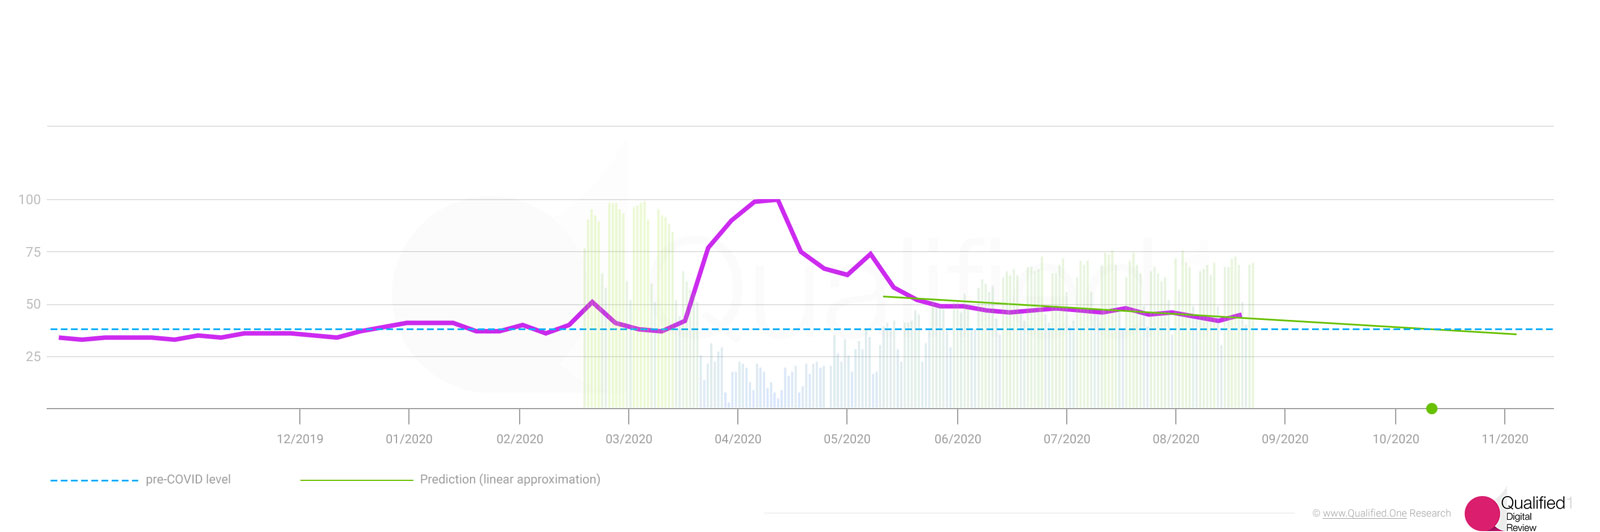
The rapid growth of the corresponding search volume (Google search engine[1], web search, USA) took place since the middle of March till the beginning of April. Next couple of months were quite messy, but starting from the June we can observe a consistent, linear decrease with an approximate slope about 3 percent points per month.
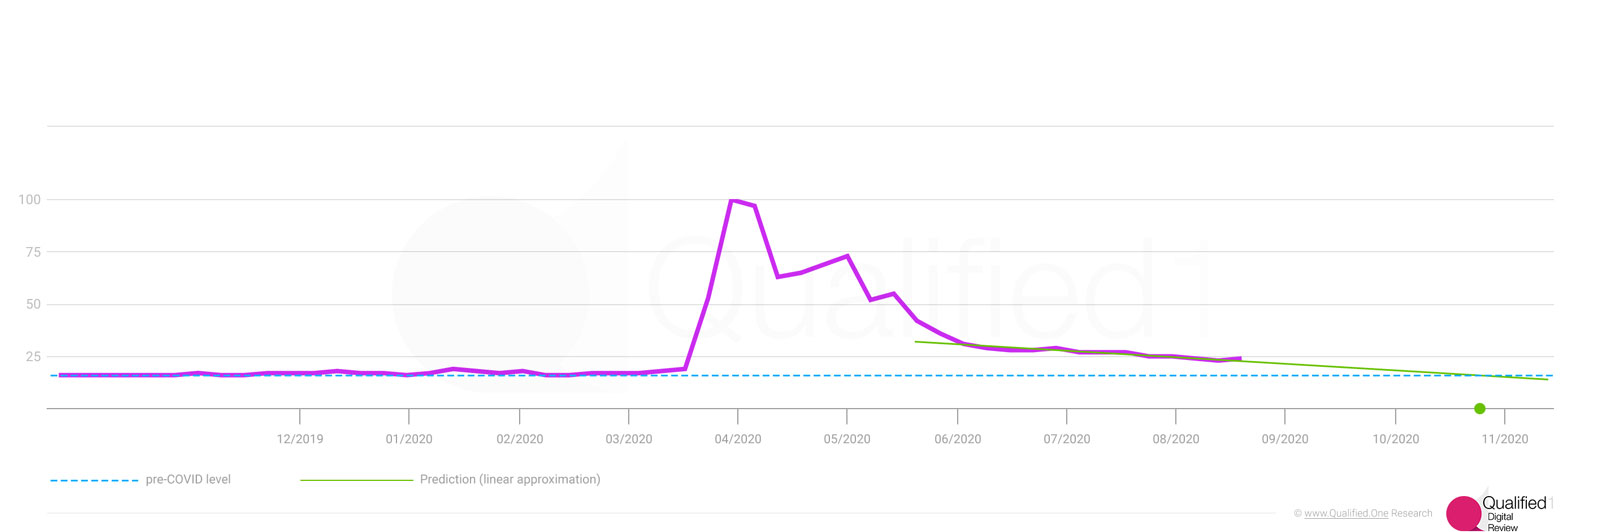
Search volume: queries containing "at home", from December 2019 till July 2020, and linear extrapolation crossing the pre-crisis line. Source: Google
This behavior can be trivially extended to the future. Linear regime can probably be continued provided that there will be no “second wave” of the virus outbreak[6], no rush in easing off the government restrictions, no political-driven perturbations [7].
With that said, we can estimate the crossing point to be in the last half of October, 2020: it is the moment when the curve approaches the pre-COVID level.
Isolation-induced queries: delivery
Another way to get the same estimation is to analyze the search demand considering delivery services. It is mostly generated by the people seeking food delivery, online store shipping and similar queries. Thus, the corresponding search volume can presumably be another metrics to characterize the “quarantined” state of things.
Activity level during lockdown (New York) and search volume: queries containing "delivery", from December 2019 till July 2020. Linear extrapolation crossing the pre-crisis line. Sources: Google, Yandex, Otonomo, Apple
This pattern is very close to the previously discussed one: rapid increase during March and partially April, then the period of uncertainty and high variance. After that the search volumes are gradually getting back to the pre-pandemic values. A simple estimation shows that we can expect the crossing point to be in the middle of October, which is quite close to the previous prediction.
An optimistic picture: retail stores
Let us get back to the real world and forget about the search engine data for a while. There is interesting data showing the dynamics of the retail stores visits in different countries[4].
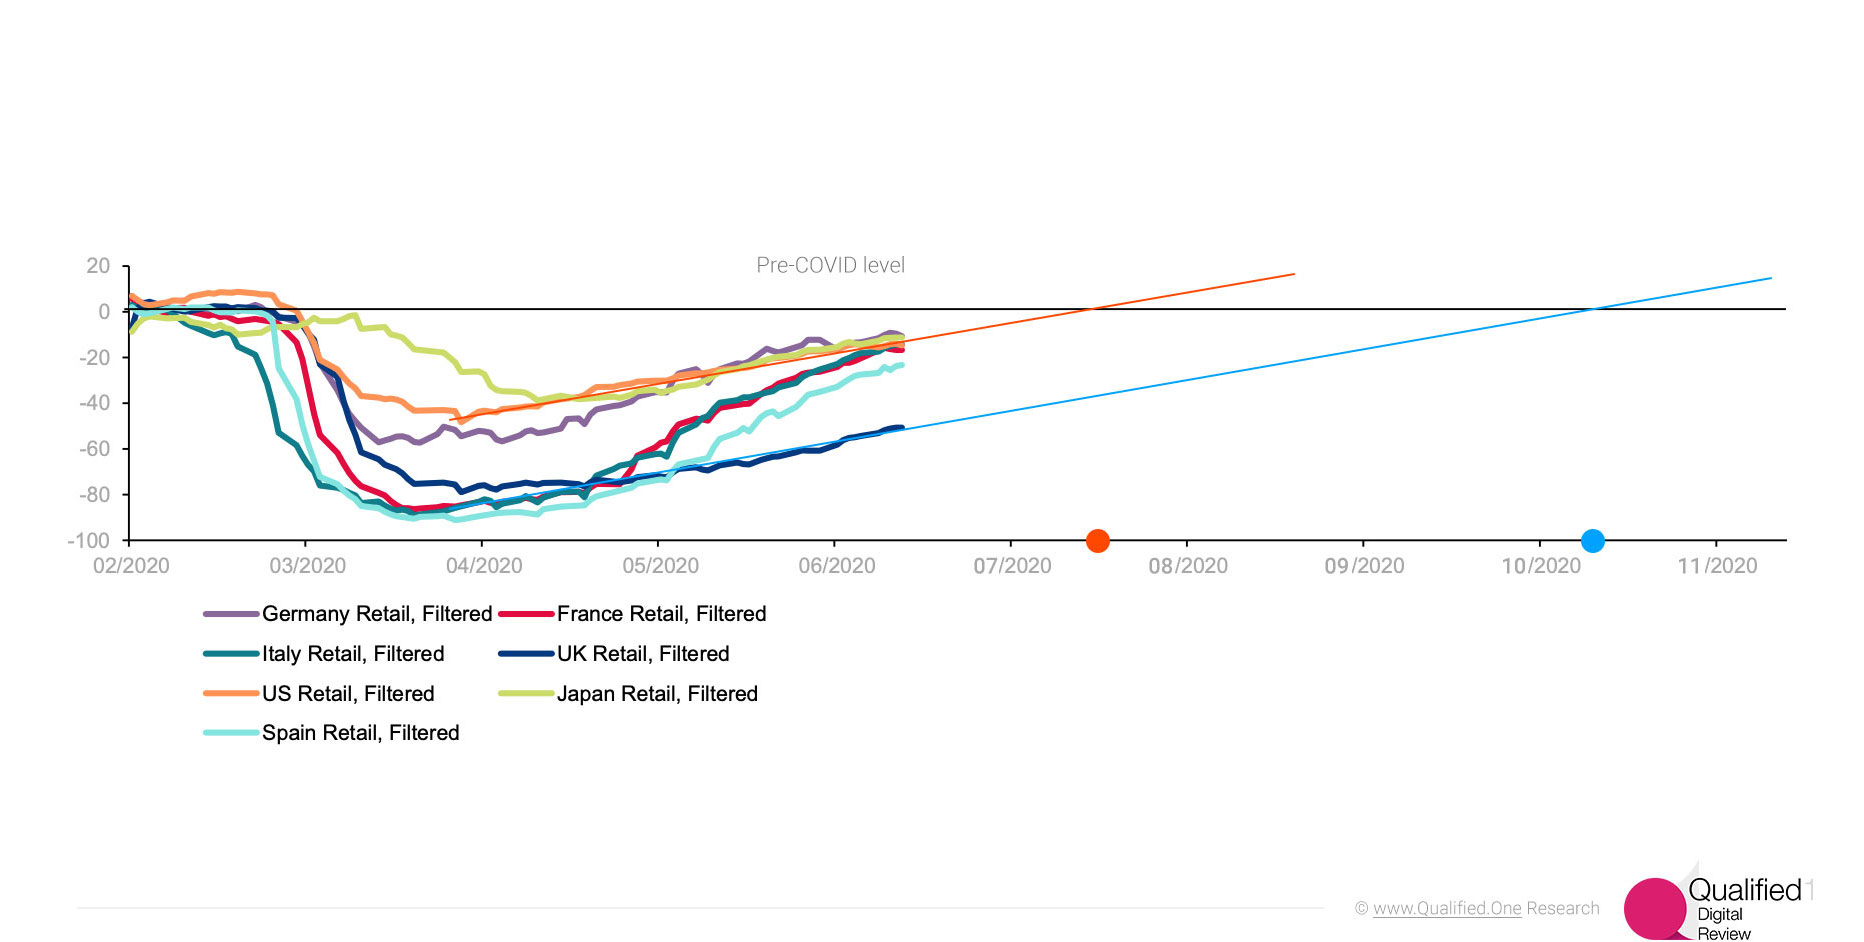
Daily Google mobility data for „Retail“, adjusted for weekends and holidays, filtered trend. Sources: Google, Allianz Research. Linear extrapolation shown for the United Kingdom and United States
On the contrary, the statistics on restaurant industry is moderate showing the reasonable estimation of the crossing point to be around the end of November, 2020:
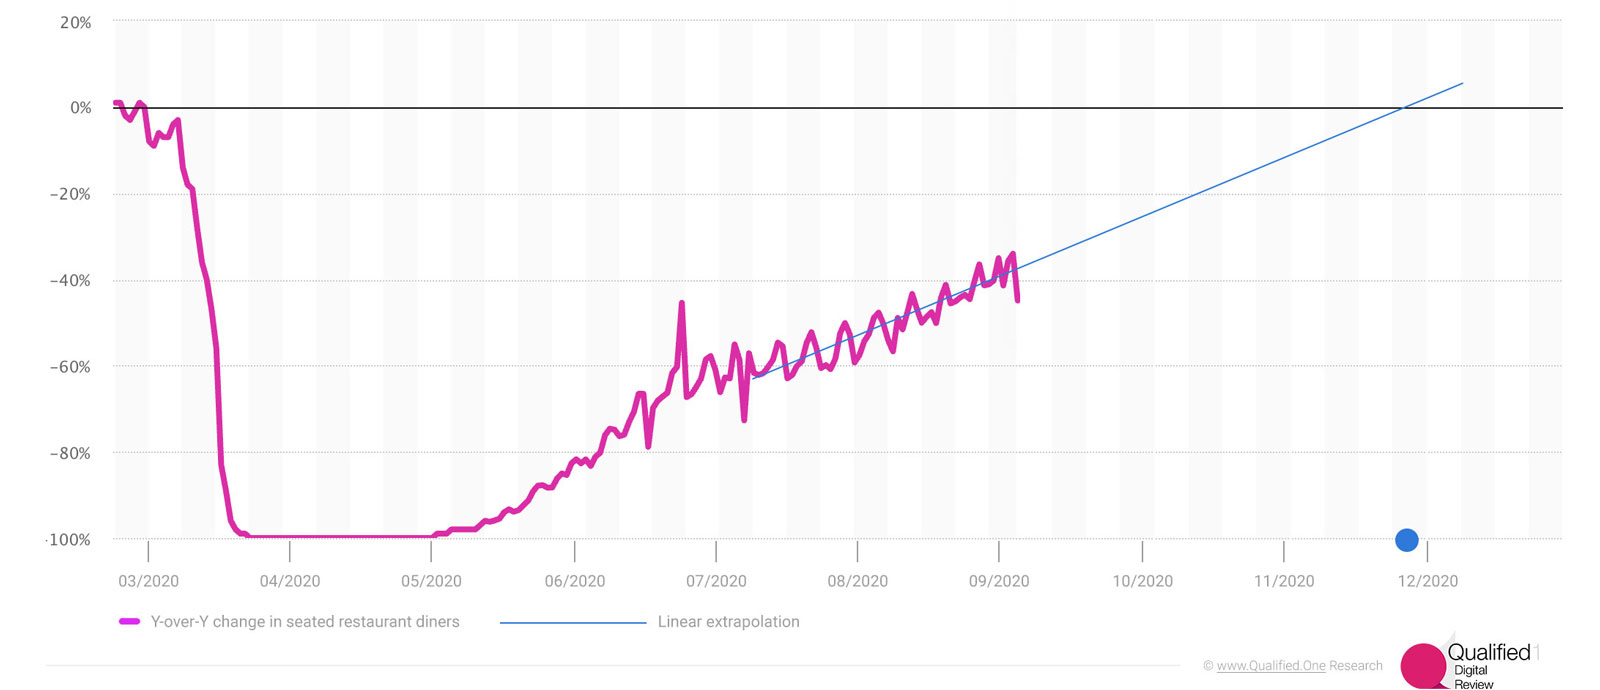
Year-over-year daily change in seated restaurant diners due to the coronavirus (COVID-19) pandemic worldwide from February 24 to August 30 (2020) and the linear extrapolation towards the pre-crisis regime. Source: Statista
One can observe a huge fall of visitors during March: the curve is mirroring the splash of delivery-related queries. The exit phase seems to have a good linear approximation as well, but the slope for United States is about 15-20 percent points per month (note the digital-inspired value of the recovery speed was around 3 percent points). It corresponds to the crossing point reached in July, which is obviously not the case. Interestingly, once again the UK stats suggest the crossing point to be in the middle in October.
Migrating to Online
Once the lockdown started to limit outdoor activities, especially those involving person-to-person communication, all businesses began a forced switch to online. However, this process was different in various industries: whilst some of them just had to move quicker, others were put in rush.
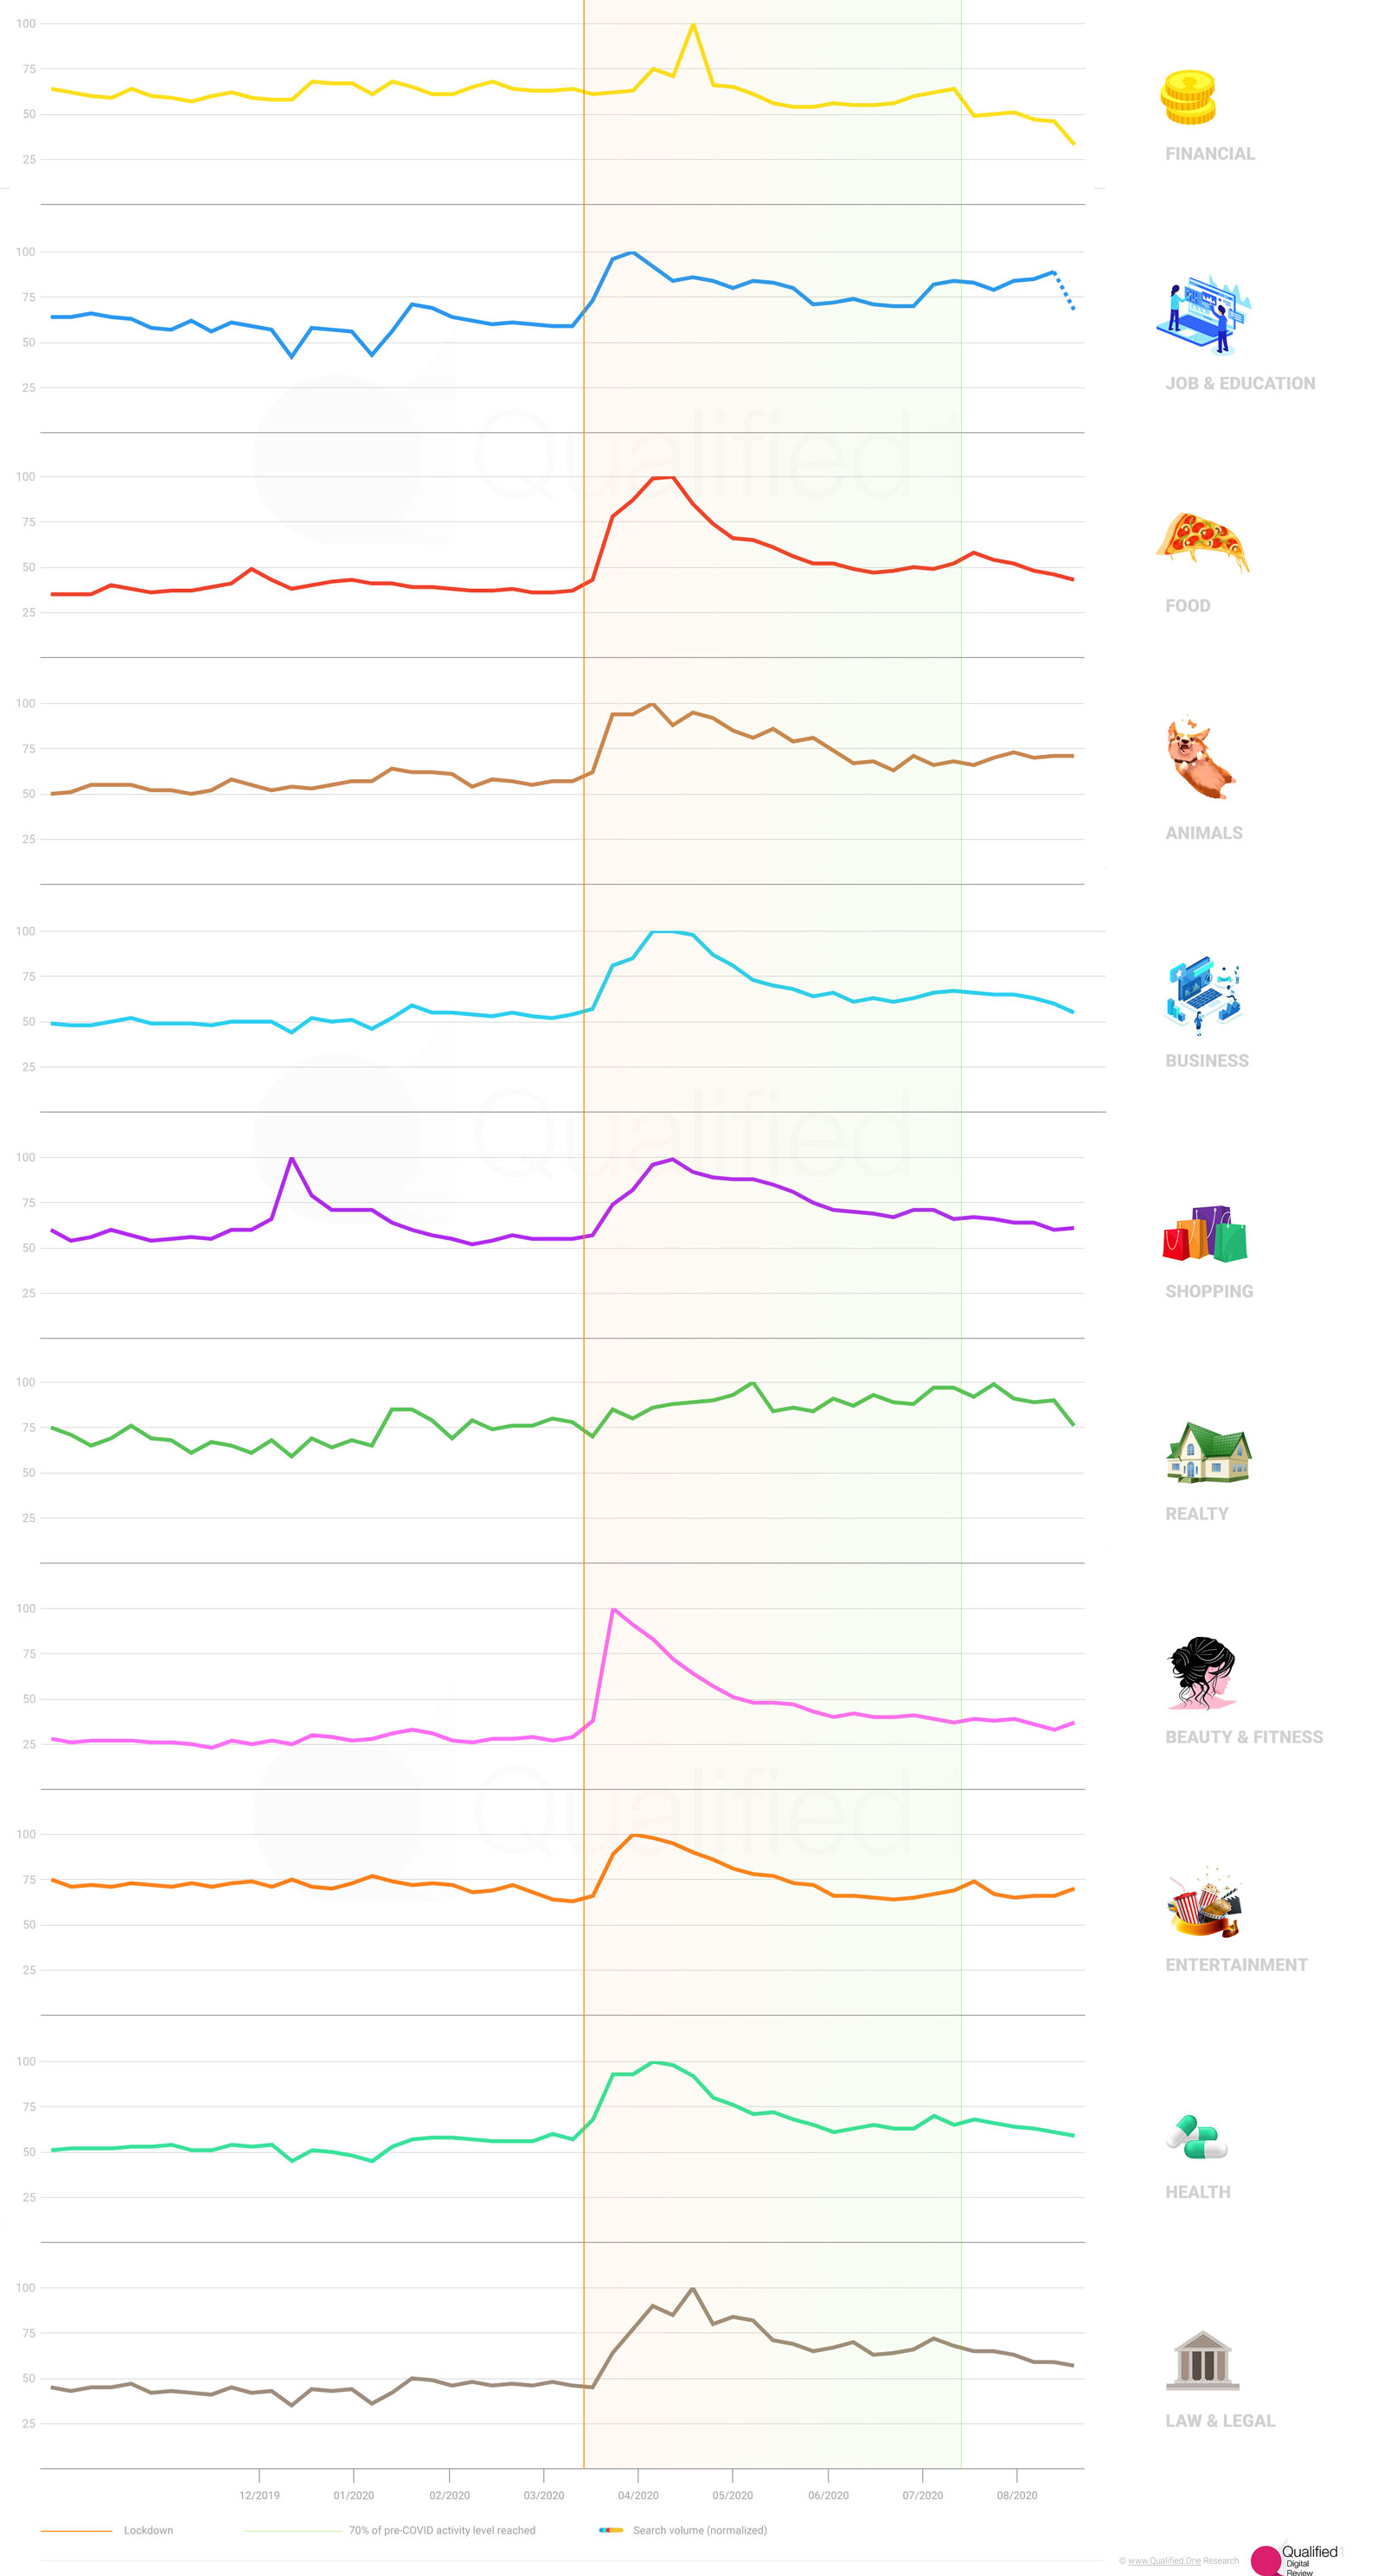
Search volume associated with the "online" word (by sector of business). Lockdown period highlighted (ending at 70% of pre-crisis activity level in New York)
This difference is likely to be dependent on each company’s digitalization level and the depth of modern technologies integration. However, it’s worth studying the overall picture divided by business sector. In what follows we show the dynamics of search volume level regarding online services or products with respect to the industry.
The rapid growth is typical for almost all of the listed business sectors, but with certain nuances.
Financial
Financial services did not experience such a quick raise of the online demand; the reason for it could be that for online banking and similar services digital innovation had already been a sustainable trend for a some time. In other words, people used to pay online well before the crisis arose[8].
Jobs & Education
Whereas the HR activity was (and still is to the certain degree) frozen, the education processes didn’t stop but migrated to online platforms like Skype and Zoom. This will probably become a new norm: online education saves a lot of time and money and also opens the way to opportunities that were previously impossible – for instance, getting a lecture from a worldwide-known superstar. A future education paradigm which offers a relatively cheap and wide-spread online education for almost everyone as a standard, plus a much more expensive option of the classic live educational process, is being widely discussed[9].
Food and Beverages
HoReCa (restaurants, bars, hotels, etc.) was hit greatly with the isolation and lockdown[10]. Food delivery turned out to be fairly the only option for many of them to survive. The graph represents a huge tsunami hitting a typical café owner with the former guests’ demand for the food delivery. Surely, not all of them were ready to such a scenario: courier service, delivery-adapted menu, mobile app, online advertising and cloud payments do not cover the whole list of the emerged problems.
Animals
For technical reasons this plot shows pets and wild animals-related search volume altogether. Nevertheless, it seems reasonable to find a significant growth of interest: all those who used to buy cat or dog food in supermarket or specialized store had to search for online alternatives. The peak, however, is about two times smoother than the previous one (food sector).
Business
Business-to-business services had to shift to online following their contractors. Once your partner is isolated in the home office, you cannot have a meeting with them anymore. Perhaps, this fact had a buffer effect: one can see that the demand level was building up slower compared to that of many other industries.
Shopping
The peak reached the same level as for the Christmas/New Year splash in the end of 2019. This is even more impressive taking into account that most people were likely to cancel a lot of non-crucial purchases. Having said that, we should also remember that due to the lockdown many buyers had to order some daily goods via the e-commerce websites. It seems that it could be somehow mixed with the Food & Beverages segment mentioned above.
Realty
Interestingly, there is no valuable effect on the realty-related online searches. Apparently, it is the only graph lacking a common wave. Probably the explanation should be based on the overall suppression of the realty market[11]: further investigation needed.
Beauty & Fitness
The search volume explosion in this sector is the most rapid one amongst the others. Consumers’ wish to stay fit was bolstered by fitness centers: generating tons of high-quality online content and trying to invent new formats (like remote videochat-based Yoga) was their response to the devastating quarantine blocking all the possible income.
Entertainment
The shape of this curve is surprisingly smooth. Given the independent stats saying that the entertainment (for instance, watching films online, etc) experienced a strong growth[12], we might consider this graph not to be representative. A deep dive in search queries will probably uncover the underlying factors which lead to such a moderate wave amplitude.
Health
Health and medicine is not the most overinflated niche in terms of search queries. Though, the curve shape looks pretty much like the average one. Presumably, in urgent cases people used to choose phone as a preferable contact channel instead of looking for “medical services online”.
Law & Legal
Locking everything down does not necessarily mean the absence of claims and other legal activity. The raise of search volume in this sector is illustrated well by the following Top-5 leading queries (Google web search):
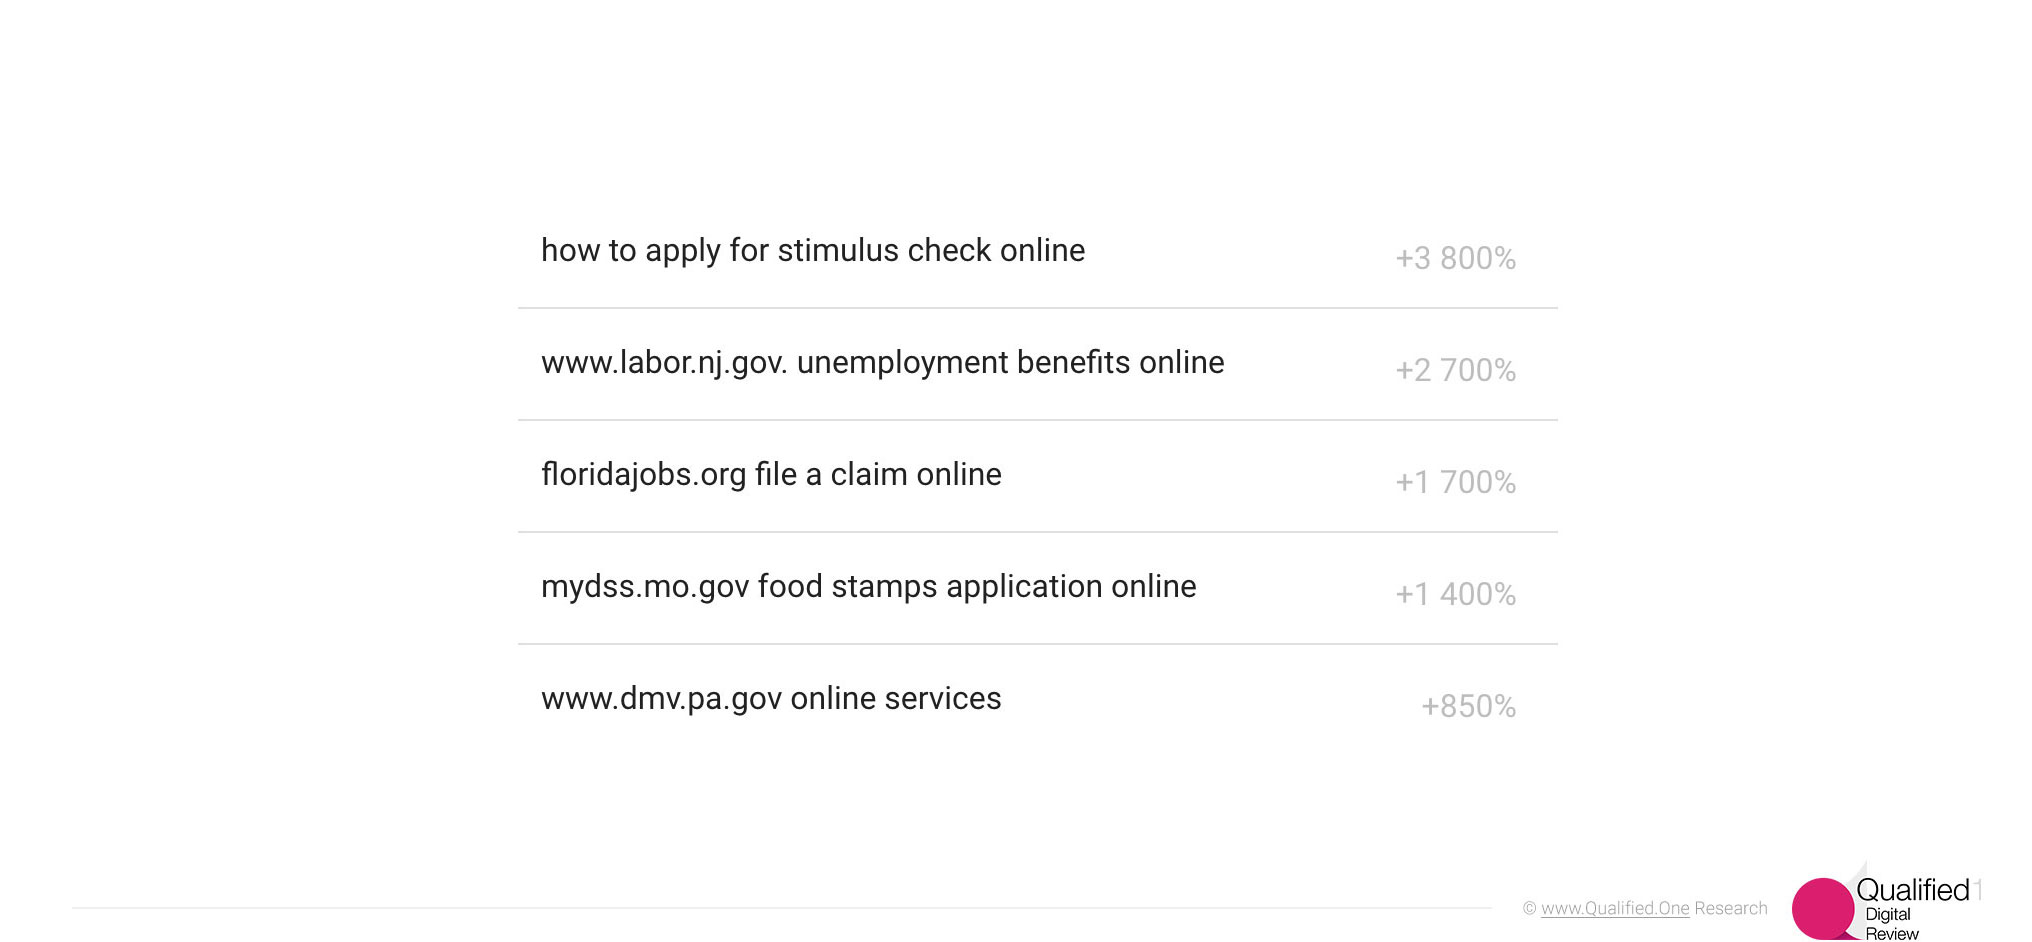
Search queries (Google web search) containing "online", Law & Legal business sector. Top-5 shown (by growth speed). Source: Google
Marketing & Advertising
Following the global changes, businesses had to amend their marketing strategies. Generally, this amendment can be explained as the shift from the classic advertising channels to the digital ones.
This process was not induced by the pandemic but was strongly enhanced with the virus outbreak.
Digital versus Classic advertising agencies
A simple way to see the mentioned trend is to compare the customer demand considering Ad Agencies and, specifically, digital agencies.
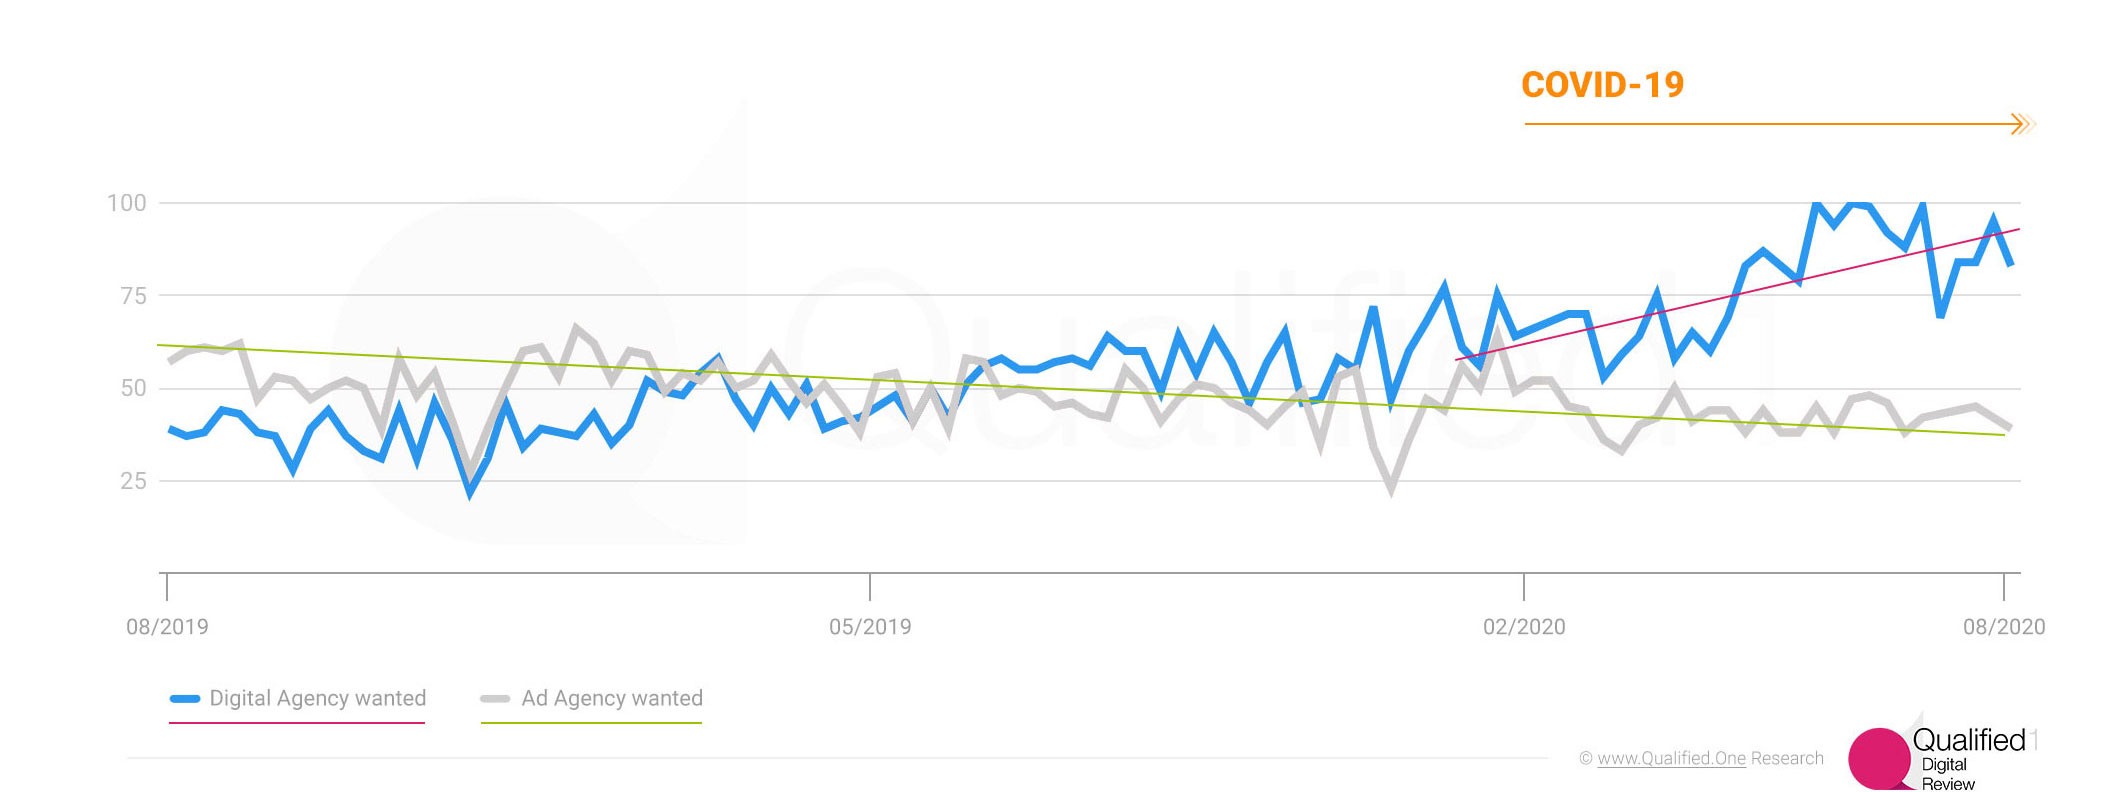
Search volume associated with "digital agency" and "ad agency". United States, from August 2019 till July 2020. Long-term trend shown for "Ad agency" curve, mid-term trend beginning with the rise of COVID-19 pandemic shown for "Digital agency" curve. Source: Google
Obviously, the popularity of Advertising Agencies is constantly decreasing, whereas the Digital services are gaining more and more search volume. However, the did its job: there is a distinct change in growth rate for the Digital curve around the end of the first quarter. This is it: the process of digital transformation regarding the Ad industry was catalyzed by the COVID-19 pandemic, making it times more rapid than it used to be before.
Digital Marketing channels evolution
As we mentioned above, digitalization itself is not (and was not) a question or concern: it is an inevitable transformation of marketing and advertisement. The question is – what exactly should the business owner (or the head of Digital/Marketing) do in the current circumstances?
It is even more complicated given the variety of tools and methods arose in the field of Digital Marketing during past years.
To simplify it to the certain extent, we divide the Digital inbound marketing channels into the two groups. The first one includes Search Engine Optimisation (SEO) and the Content Marketing. These channels require persistency and constant investments but can pay back with a great ROMI. The second one includes paid advertisement: Google Ads and Facebook Ads. Paid traffic is much simpler to get but normally the return on investment is lower compared with the first group channels.

Activity during lockdown (New York) and the search volume associated with customer demand on Content marketing, SEO, Google Ads and Facebook Ads. Source: Google, Yandex, Otonomo, Apple
Paid advertisement does not require long preparations: it is a well-controllable marketing channel, which can be shown by the corresponding search volume escalation followed by short and deep breakdown around Christmas/New Year.
A similar, though more sharp behavior is present in the period of COVID-19 pandemic. Note that there are no significant trend changes for the SEO/Content Marketing curves: it looks like the crisis has not affected them. On the contrary, one can see a peak for the Google Ads curve, as well as for the Facebook Ads.
Unlike the previously discussed metrics, this one does not exactly match with the lockdown: there is a 3-month gap between the activity decrease in March and the raise of the search volume in the middle of June. A reasonable explanation is that many businesses had to adapt to the quickly changing environment and, perhaps, to get through first months of total uncertainty before investing into the paid ads.
Digital Marketing: Year-to-Year comparison
In previous section we saw the splash of the paid ads demand with the start of the pandemic; however, it seems we have already passed it. Let us now compare the popularity of the digital marketing channels under consideration with the values of August, 2019[1].
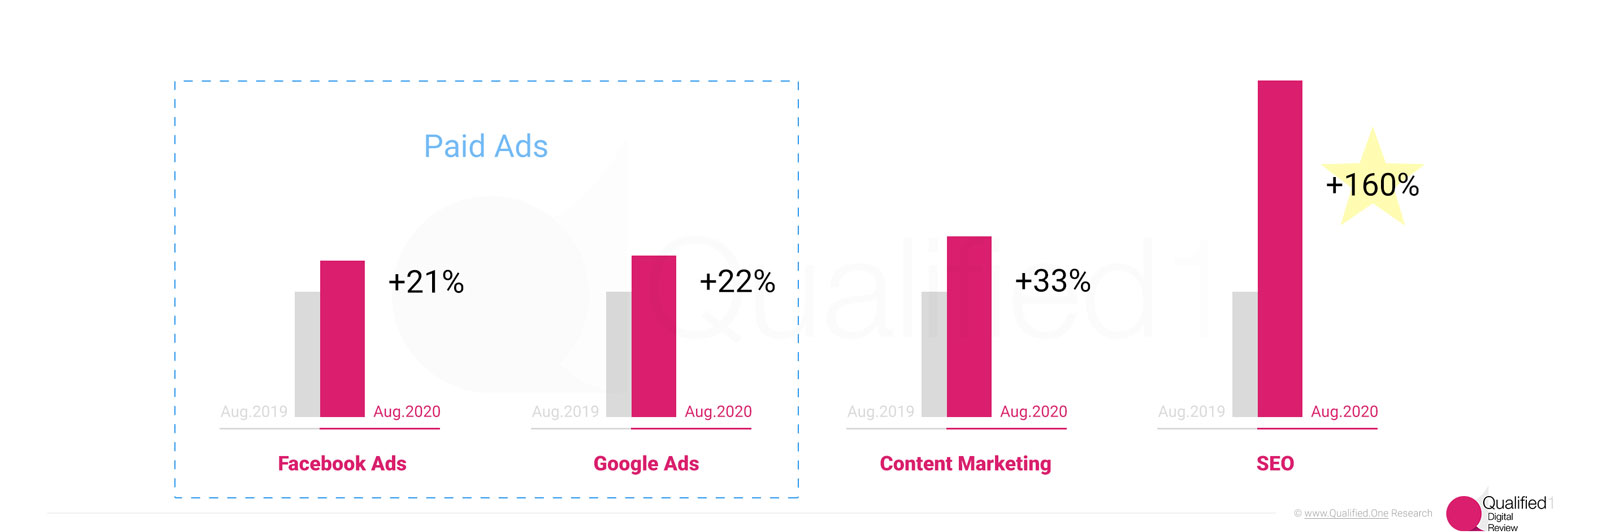
Customer demand estimation based on search volume, year-to-year comparison 2019/2020, United States. Source: Google
It appears that for the US market there is a definite leader: in August, 2020 the Search Engine Optimisation is being searched for 2.6 times more frequently than a year ago. It means 160% Y-to-Y growth. Given the smooth shape of the SEO-related searches curve, this fact doesn’t seem to be an accidental one.
The Content marketing queries volume is 33% ahead of the 2019 level, whereas the paid channels show the yearly growth about 21-22%.
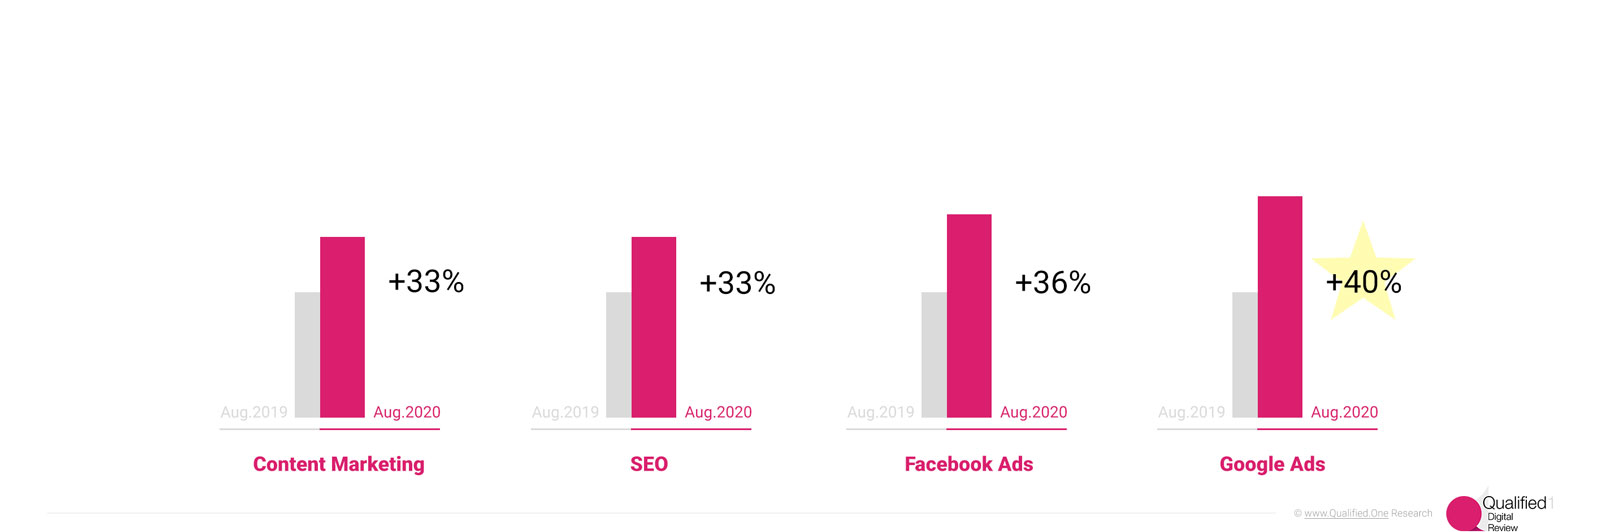
Customer demand estimation based on search volume, year-to-year comparison 2019/2020, worldwide. Source: Google
This, however, is not a universal trend. The worldwide stats are just the opposite: Facebook Ads and Google Ads are the leaders (36% and 40% growth respectively), keeping a bit ahead of the SEO and Content Marketing (+33% growth). The reasons for that are unclear; one of the possibilities is that many of companies outside of the United States could have been ignoring the paid ads for some time, but had to implement these tools into their marketing as the lockdown started.
Conclusion
The sustainable trend of digitalization has been pushed by the COVID-19 pandemic towards to even more rapid pervasion of digital tools and methods than previously. In fact, this process turned to be an inevitable future instead of just a preferable way of development.
Almost all of the industries experienced a rapid growth of the demand considering online stores and services. The forced many businesses to amend their marketing strategies: some had to start their paid ads in a rush, others were having dividends from previous investments to Content Marketing and SEO.
Current recovery regime is likely to bring us to the pre-COVID state of things (considering online behavior) around the end of October. This, of course, is subject to change depending on the new possible virus outbreaks and the following lockdowns.
References
-
[1] Google Trends
[2] Allianz research
[3] Yandex, LLC
[4] Retail store visits, EH
[5] Coronavirus’ impact on service organizations / McKinsey & Company
[6] 'One big wave' – why the Covid-19 second wave may not exist / The Guardian
[7] A second wave of coronavirus? / Washington Post
[8] COVID-19’s impact on banking & capital market institutions / Deloitte
[9] Impact of the COVID-19 pandemic on education / Wikipedia
[10] Year-over-year daily change in seated restaurant diners due to the coronavirus (COVID-19) pandemic worldwide from February 24 to August 30; 2020 / Statista
[11] Understanding COVID-19’s impact on the real estate sector / Deloitte
[12] The Impact of COVID 19 on the Entertainment Market / Orion Market Research Private Limited
[13] Quarantined Marketing / Qualified.One
All materials are subject to copyright. Usage is allowed with the active hyperlink to Qualified.One website. Images can be used without amendments. The main image is based on the NASA-owned graphics and cannot be distributed in commercial needs.