Some details
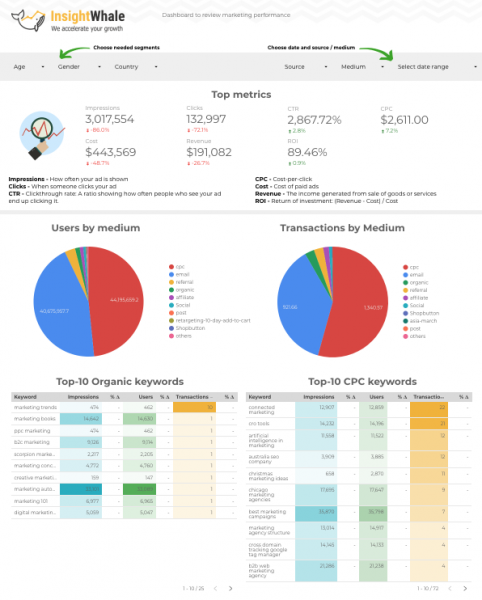
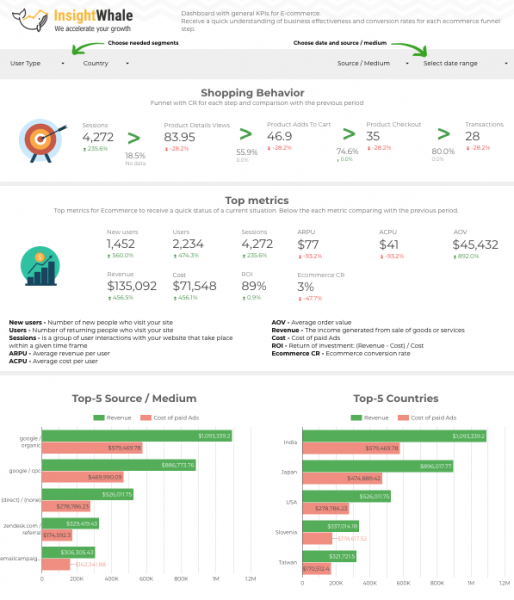
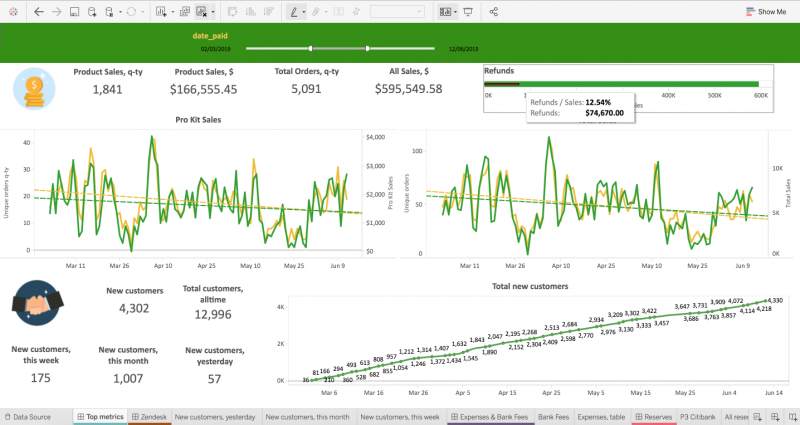
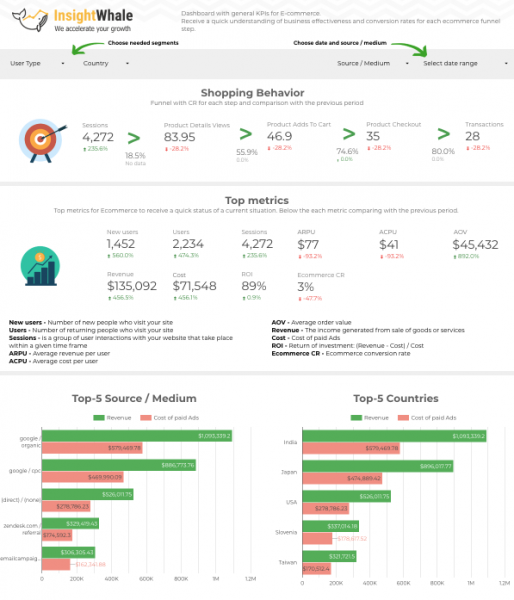
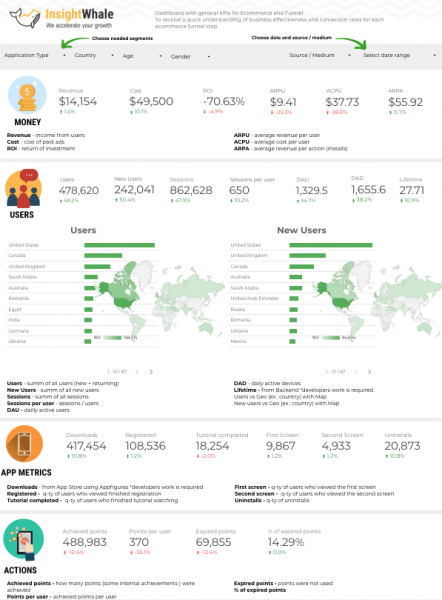
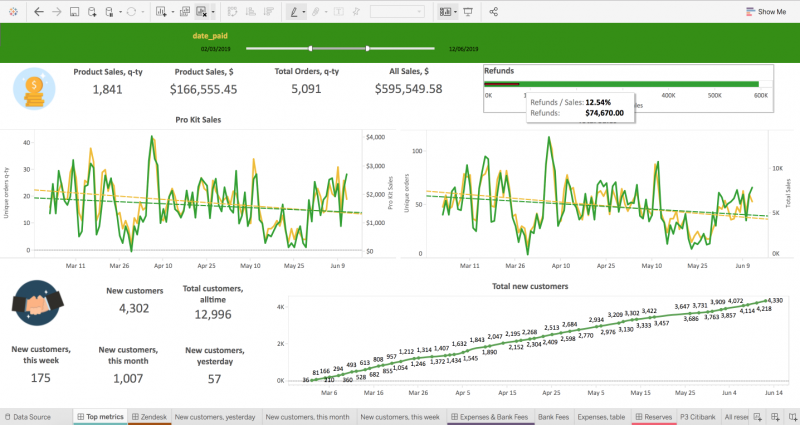
In this project we needed to create a meaningful visualization of multiple data sources.
What we did:
- Analyzed the business.
- Created dashboards wireframes and discussed with the client.
- Used various connectors to push data into Tableau.
- Created our own connectors for non standard data sources.
- Created visualizations of data, broken down by the tasks they help bsuiness

