
Some details
CHALLENGE
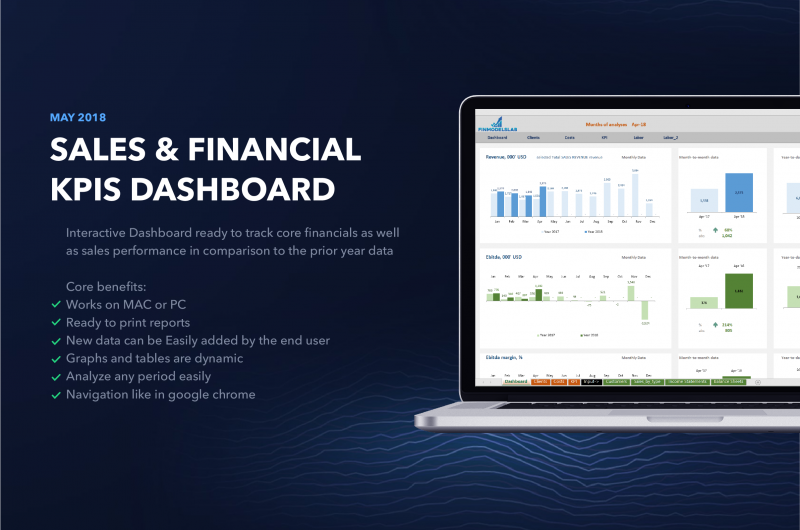
The customer wanted to have the Interactive Dashboard ready to track core financials as well as sales performance in comparison to the prior year data.
SOLUTION
We made the Excel dashboard with core benefits
- MAC or PC
- Ready to print reports
- Easily add new data
- Dynamic graphs and tables
- Analyze any
At the Dashboard tab user can see
- Revenue
- Ebitda
- Net Income
Have any questions? – Just message us with anything you would like to know.