
In Data Science
Let us learn about the concept of data wrangling and its importance in data analysis. We'll also discuss how data wrangling and visualization can work together to streamline your data analysis process.

Editor
Data is everywhere. Every day, we generate massive amounts of data from our online activities, devices, and interactions. Companies and organizations are also collecting large amounts of data to gain insights into customer behavior, market trends, and other important business metrics. However, the raw data collected is often messy, unstructured, and difficult to analyze. This is where data wrangling comes in.
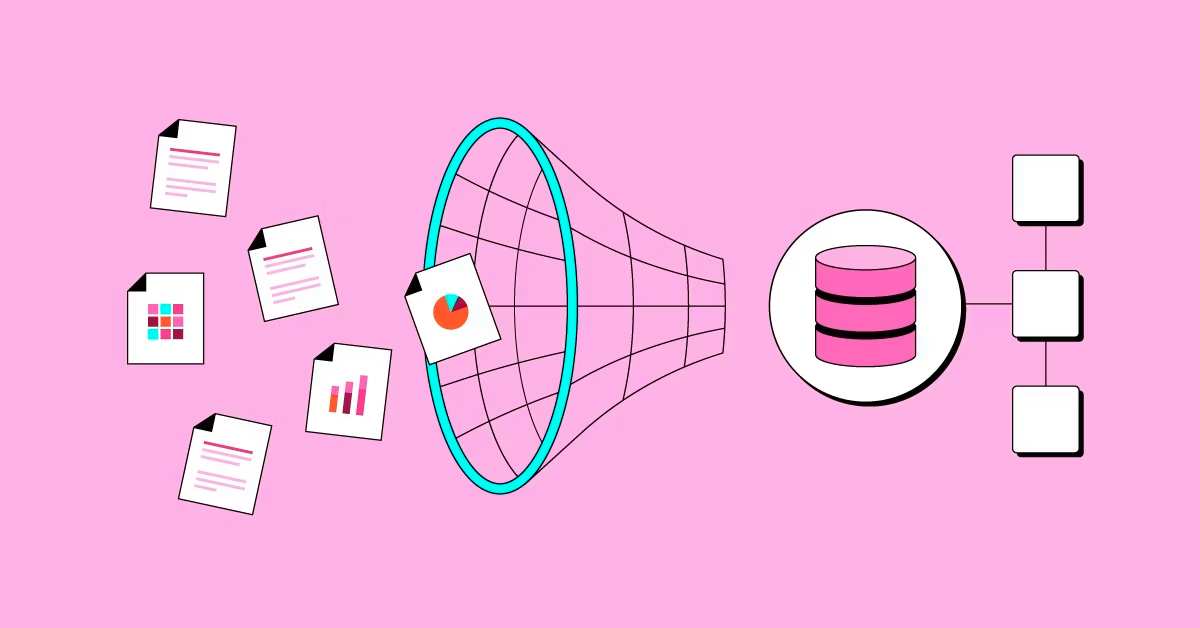
Data wrangling, also known as data cleaning or data preparation, is the process of transforming raw data into a usable format for analysis.
What is Data Wrangling?
Data wrangling involves a series of tasks that transform raw data into a structured format that can be analyzed. This includes tasks such as data cleaning, data transformation, and data integration. The goal of data wrangling is to improve the quality of the data, making it easier to analyze and derive insights from.
Data cleaning involves identifying and correcting errors in the data, such as missing values, duplicates, and inconsistent formatting. Data transformation involves converting data from one format to another, such as changing date formats or converting text to numeric values. Data integration involves combining data from multiple sources into a single dataset for analysis.
Data Wrangling Techniques
| Data Wrangling Technique | Description | Example |
|---|---|---|
| Data Cleaning | Identifying and correcting errors in the data, such as missing values, duplicates, and inconsistent formatting. | Removing duplicate rows from a dataset. |
| Data Transformation | Converting data from one format to another, such as changing date formats or converting text to numeric values. | Converting text data to numerical data using regular expressions. |
| Data Aggregation | Combining multiple rows or datasets into a single row or dataset. | Summarizing sales data by month or year. |
| Data Reshaping | Changing the structure of the data, such as pivoting or unpivoting the data. | Pivoting a dataset to show sales data by product and quarter. |
| Data Splitting | Splitting a single column into multiple columns or splitting a single dataset into multiple datasets. | Separating first and last names into separate columns. |
| Data Merging | Combining data from multiple datasets based on a common key. | Merging customer data with sales data based on customer ID. |
| Data Deduplication | Identifying and removing duplicate rows in a dataset. | Removing rows with duplicate customer ID numbers. |
Note: These data wrangling techniques are not exhaustive and may vary depending on the specific data analysis needs. Also, the examples listed here are not exhaustive and may vary depending on the specific data analysis needs.
Why is Data Wrangling Important?
Data wrangling is important because it ensures that the data used for analysis is accurate, consistent, and complete. Without data wrangling, data analysis can be inaccurate, leading to incorrect insights and decisions. Additionally, data wrangling can save time in the analysis process by streamlining data preparation tasks and making data analysis easier.
Data Visualization: Making Sense of Your Data
Data visualization is the process of creating visual representations of data to help make sense of it. Data visualization tools can be used to create charts, graphs, and other visualizations that make it easier to understand complex data. Data visualization can be used to identify patterns, trends, and outliers in the data, making it easier to draw insights from the data.
How Data Wrangling and Visualization Work Together
Data wrangling and visualization work together to streamline the data analysis process. By cleaning and transforming the data, data wrangling makes it easier to create visualizations that accurately represent the data. Data visualization, in turn, can help identify errors or inconsistencies in the data that need to be corrected through data wrangling.
For example, imagine you are analyzing customer data for a marketing campaign. Through data wrangling, you identify and correct missing values, duplicates, and inconsistent formatting in the data. You then use data visualization tools to create a graph showing the distribution of customer ages. This visualization helps you identify an outlier in the data – a customer who is 120 years old. By correcting this error through data wrangling, you can improve the accuracy of your analysis and decision-making.
To Summarize
Data wrangling and visualization are essential components of the data analysis process. By transforming raw data into a structured format and creating visualizations that make it easier to understand, data wrangling and visualization can help organizations gain insights and make informed decisions. If you're interested in learning more about data wrangling and visualization, there are many resources available online. Here are a few links to get you started:
- What is Data Wrangling? (DataCamp)
- The Importance of Data Visualization (Forbes)
- The Best Data Visualization Tools (PCMag)