
In Market Research
The Bitcoin Fear and Greed Index is based on the fact that in the market, people get greedy when the market rises.

Management
This leads to the so-called FOMO or foregone profit syndrome, people try to "get into" overbought assets and grab at least some interest from a "rocket" that has already taken off. On the other hand, when people see a falling market and scary red candles, they react irrationally and make emotional decisions about their assets, most often getting rid of them at their own loss.
![Bitcoin fear and greed index as of today [updated]](https://alternative.me/crypto/fear-and-greed-index.png)
Bitcoin fear and greed index as of today [updated]
The developers of the Fear and Greed Index have tried to save the average user from emotional stress and from wasting time analyzing the market situation.
In their view, there are two basic assumptions:
- Extreme fear can be a sign that investors are overly concerned. It can be a good opportunity to buy an asset. When investors become overly greedy, it means that a correction is needed in the market.
That is, the Fear and Greed Index analyses the current market sentiment, which is represented as a simple number between 0 and 100. Where 0 means "Extreme Fear" and 100 means "Extreme Greed".
How to interpret the results of the Bitcoin Fear and Greed Index
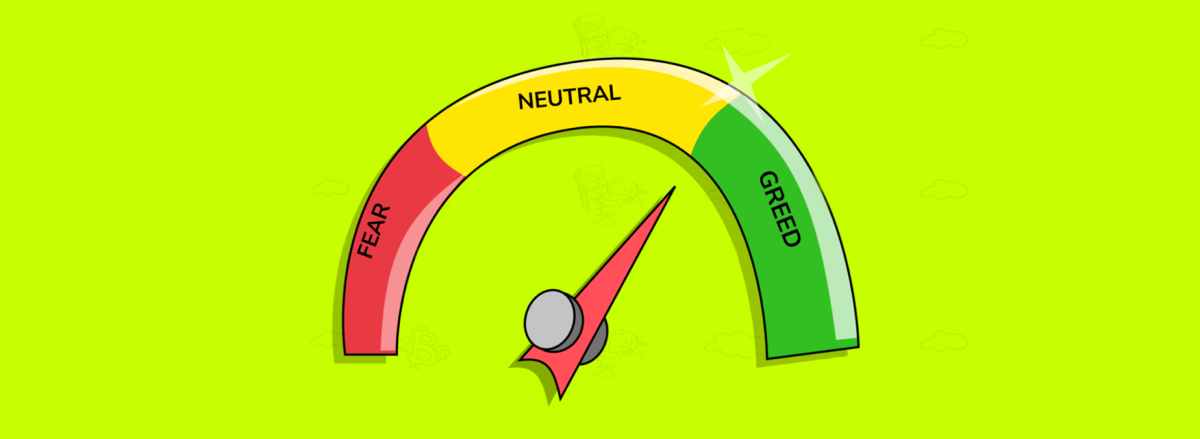
The index looks like a measuring instrument with an arrow. Depending on where it points, you can get these results:
- Red zone, 0 to 25, - investors are scared.
- Orange zone, 26 to 49, - fear dominates the market.
- Grey zone, around 50, - neutral outlook.
- Light blue zone, 51 to 75 - greed dominates in the market.
- Green zone, from 76 to 100, - investors are categorically greedy.
When investors are scared, they sell stocks. As a result, their prices fall and the stock can become undervalued. So an arrow in the red zone can be a signal to buy attractive assets.
How to measure the risk of an investment
It also works the other way round: when investors are greedy, the arrow is in the green zone and could be a signal that assets are overvalued - profit taking should be considered.
The index can signal a possible reversal in the stock market, as it did, for example, on Black Thursday, 12 March 2020. In just one month, the S&P 500 Index collapsed by 30% and the Fear & Greed Index dropped from 80, i.e. extreme greed, to 5, extreme fear.
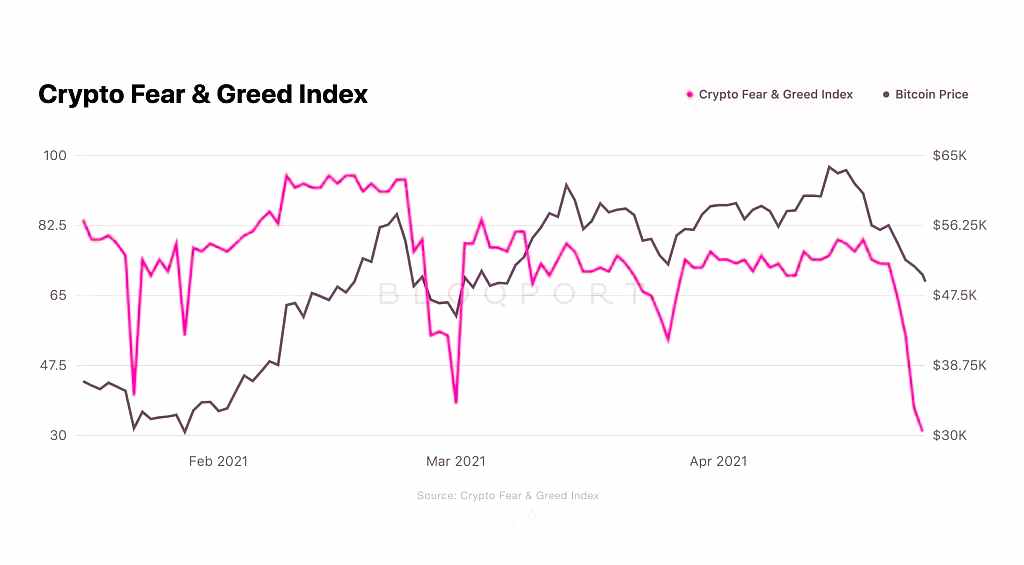
Bitcoin fear and greed index dynamics in 2021
Why measure Bitcoin fear and greed index?
Crypto market behaviour is very emotional. People tend to get greedy when the market rises, leading to FOMO (fear of missing out). Also, people often sell their coins because of an irrational reaction to red numbers. With our Fear and Greed Index, we try to save you from your own emotional overload. There are two simple assumptions:
- Extreme fear could be a sign that investors are too anxious. It could be an opportunity to buy.
- When investors get too greedy, it means the market needs to correct.
So we analyse the current sentiment in the bitcoin market and collate the numbers into a simple counter from 0 to 100. Zero means "extreme fear" and 100 means "extreme greed". See below for more information on our data sources.
Bitcoin Fear and Greed Index methodology
Six parameters are used to determine the Fear and Greed Index. Each is evaluated in the same way as the previous day to clearly demonstrate the change in sentiment in the crypto market.
This index is only for Bitcoin (separate indices for major altcoins will be developed soon), and price volatility is the determining factor. A list of all factors that influence the index figure:
Volatility (25%)
The current volatility and the maximum BTC drawdowns are measured and compared to the respective averages of the last 30 and 90 days. An unusual spike in volatility is a sign of a "scary" market.
Impulse / Market Volume (25%)
The current volume and market momentum are measured (again compared to the average values of the last 30/90 days), then the two values are correlated. Generally speaking, if market volume is high daily amid positive conditions, it means that market players are being too greedy (too bull-headed).
Social media (15%)
At the moment this parameter is determined by analysis on Twitter. This social network collects and counts posts with different hashtags for each coin; it then analyses how quickly and actively users reacted to these posts over certain periods of time. Unusually active reactions result in an increase in public interest in the coin and, in the developers' view, reflect the greed of market players.
Surveys (15%)
Together with the strawpoll.com platform, the developers of the Greed and Fear Index conduct weekly surveys to find out how people perceive the current market situation. Each survey has 2,000-3,000 participants and this is how the mood of crypto investors is formed.
Dominance (10%)
A coin's dominance is something similar to a coin's share of the total market capitalisation. In the case of Bitcoin: the developers believe that Bitcoin's rise in dominance is driven by the fear of extremely speculative investment in altcoins, so Bitcoin is becoming a safer tool to preserve capital. Conversely, when BTC's dominance decreases, it means that people are being overly greedy, investing in riskier altcoins, dreaming of the opportunity to participate in a new large-scale bull rally. It's worth noting that the rise in dominance of any altcoin, on the other hand, causes more interest in the coin and can lead to extremely bullish/greedy behaviour in the market for that particular coin.
Trends (10%)
Google Trends data for various search queries related to Bitcoin is analysed. Particular attention is paid to changes in search query volumes, as well as recommended and popular queries at the moment. For example, checking the word "Bitcoin" in Google Trends will only reflect the popularity of the query (search query volume). But as of now (29.05.2018), for example, the number of queries for "Bitcoin price manipulation" in the related section has increased by 1.550%. This is a clear sign of fear in the market and this fact is reflected in the index figure.
What is the Fear and Greed Index of a market?
Warren Buffett warned: "Be careful when others are greedy. Be greedy when others are being greedy". It remains to understand the mood of the crowd. The Fear and Greed Index helps in this.
This index was introduced by CNNMoney. It is used to gauge which mood prevails in the stock market: whether prices are trending up or down.
The index is primarily interesting because it takes into account the correlation of two important emotions of investors in the market - fear and greed - through seven market parameters, which have equal weight in the index.