
Some details
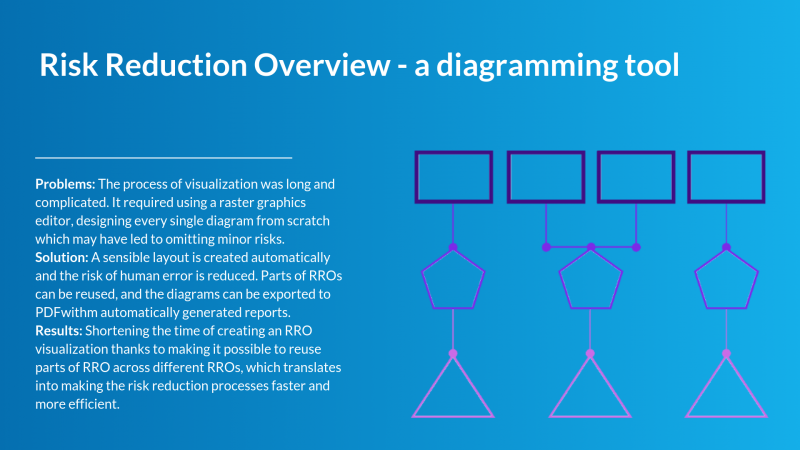
The RRO is a diagram that shows risks, measures and the corresponding residual risk in a coherent and logical overview. This overview is used as a part of risk management processes – to better assess the risks, better plan the solutions, and report them is an explicit way.
It can be used by state institutions, as well as any other organization that deals with any sort of risk: data leakage, shortage of equipment,
possible project delays, etc.Goal
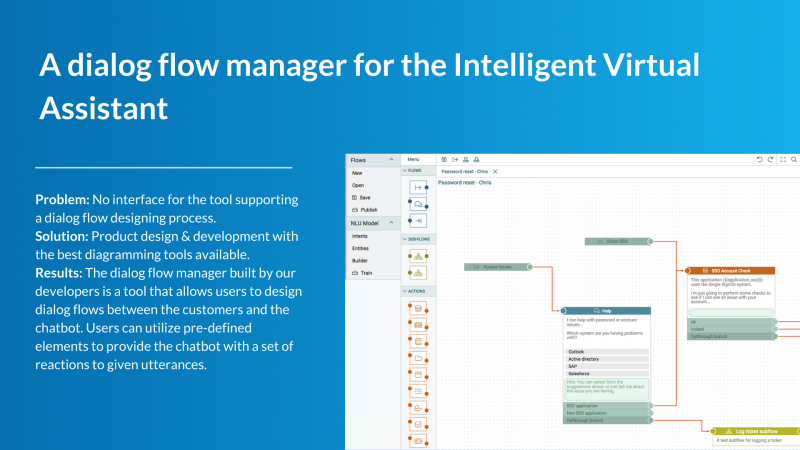
When we were approached by the Ministry of Defence, our goal was to build a tool that would support creating the RRO visualization to help them control risks better. The whole process consisted of identifying the actions that may lead to risk, describing the risks, finding ways to prevent them, visualizing the whole risk reduction plan, and reporting. Our goal was to make this process faster, easier, and more efficient.
Challenges
1.The process of visualization was long and complicated. It required using a raster graphics editor, designing every single diagram from scratch.
2. The reports were created manually for every diagram. That required a lot of time and effort of people involved in this task.
3. The complicated and time-consuming process of risk visualization may have led to omitting minor risks – the less probable to occur, the less likely would the person responsible for the visualization take that risk into consideration and put it on a diagram.
More at: http://bit.ly/2ImVQyh