
In Business Intelligence & Analytics
The order of operations in Tableau is a topic that all Tableau users should be intimately familiar with.

Management

If you don't understand the order of operations, you will be constantly frustrated when trying to solve a problem that doesn't work as expected.
So, in this blog, I'm going to briefly introduce the Order of Operations and each of its components and share five common problems with the Order of Operations, along with how to address them.
What is Tableau order of operations?
The order of operations in Tableau is similar to the order of operations in mathematics, which we all learned early in our school careers - remember - first come the items in parentheses, then powers, then multiplication and division, followed by addition and subtraction.
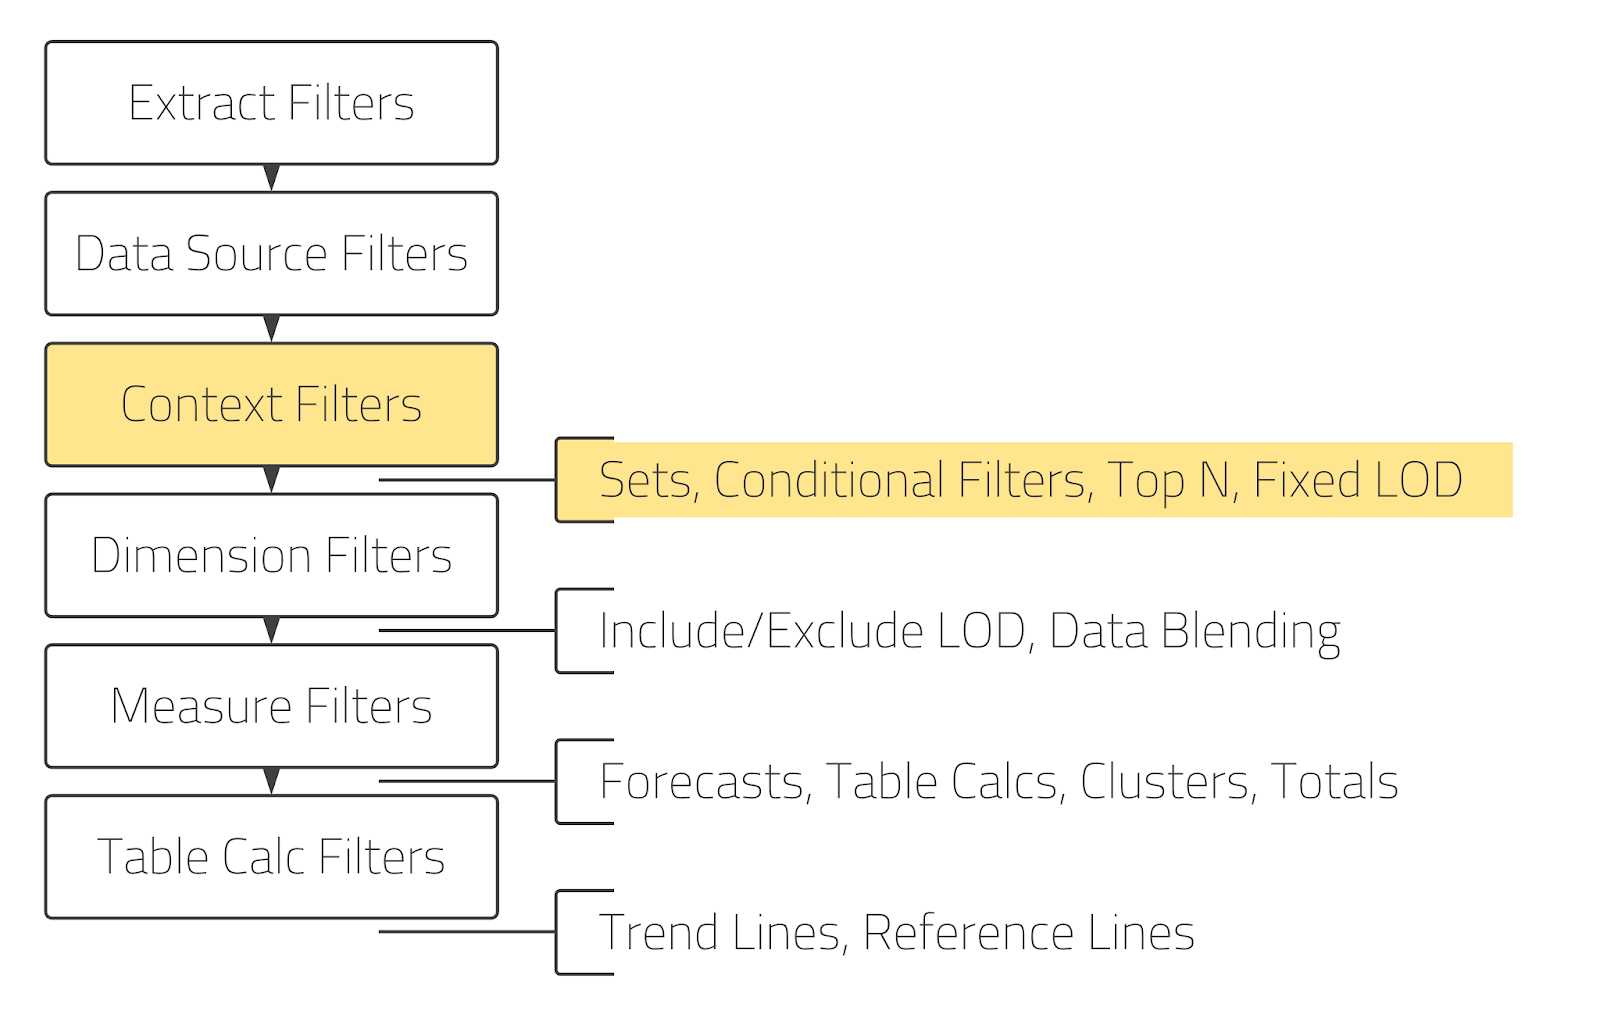
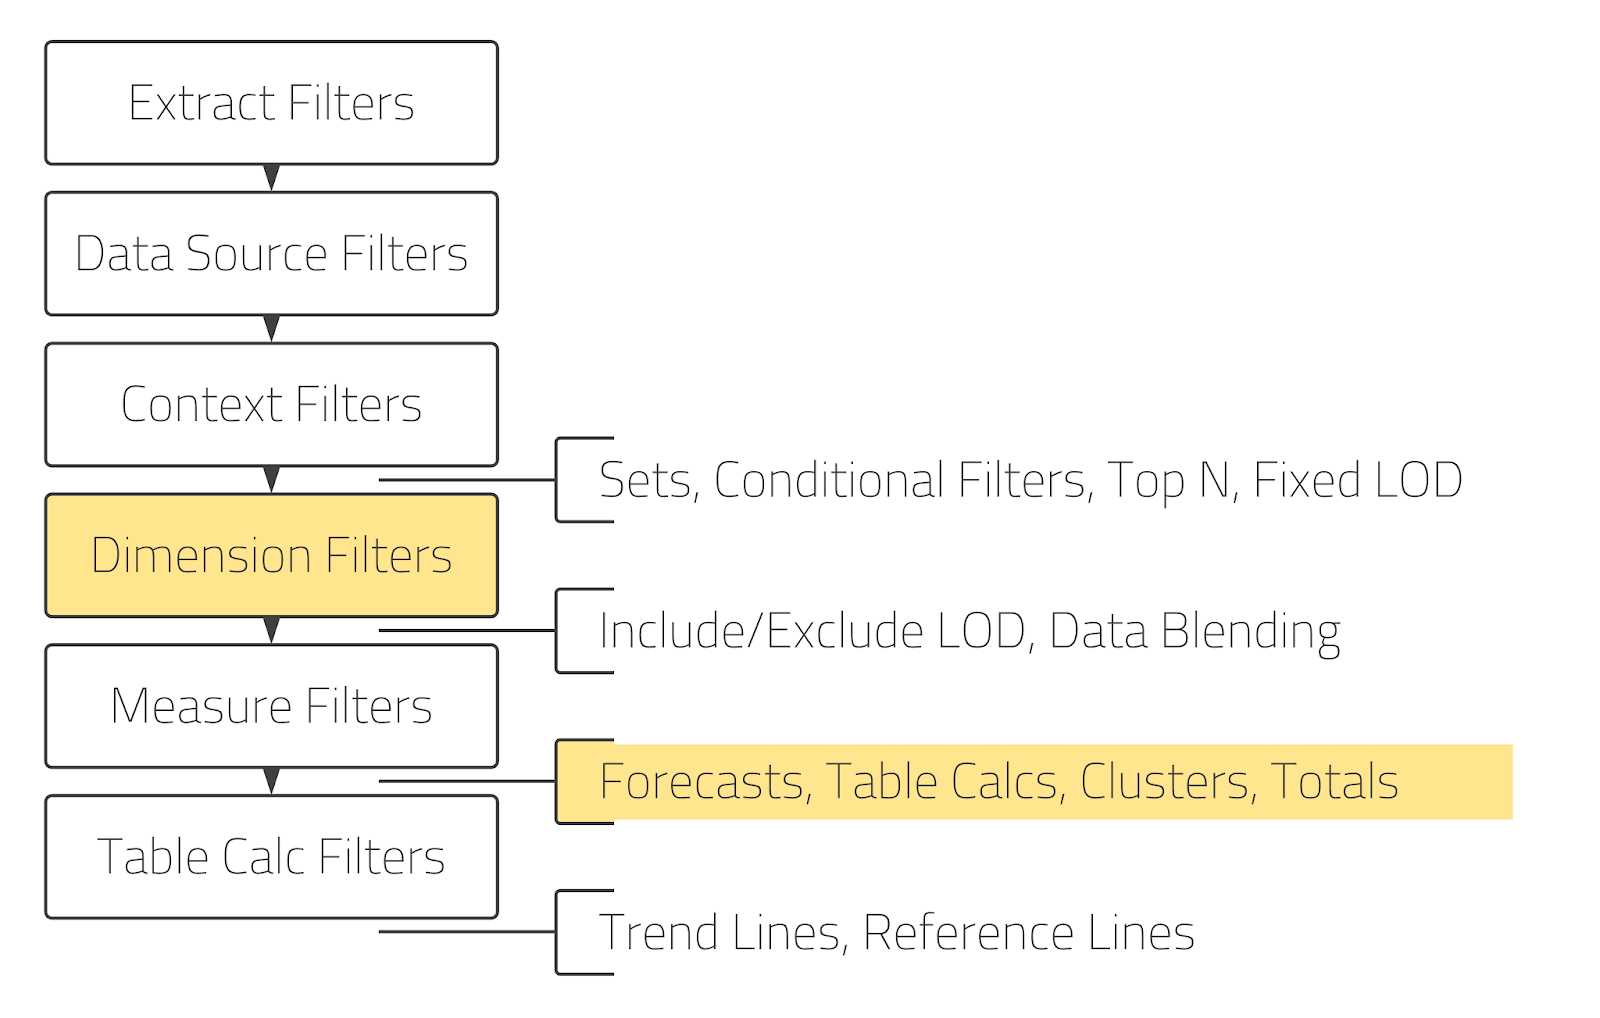
Tableau's order of operations is quite similar, indicating the order between the various operations in Tableau - filters, calculated fields, and other Tableau functions - execution and/or calculation. Here is the order of operations in Tableau.
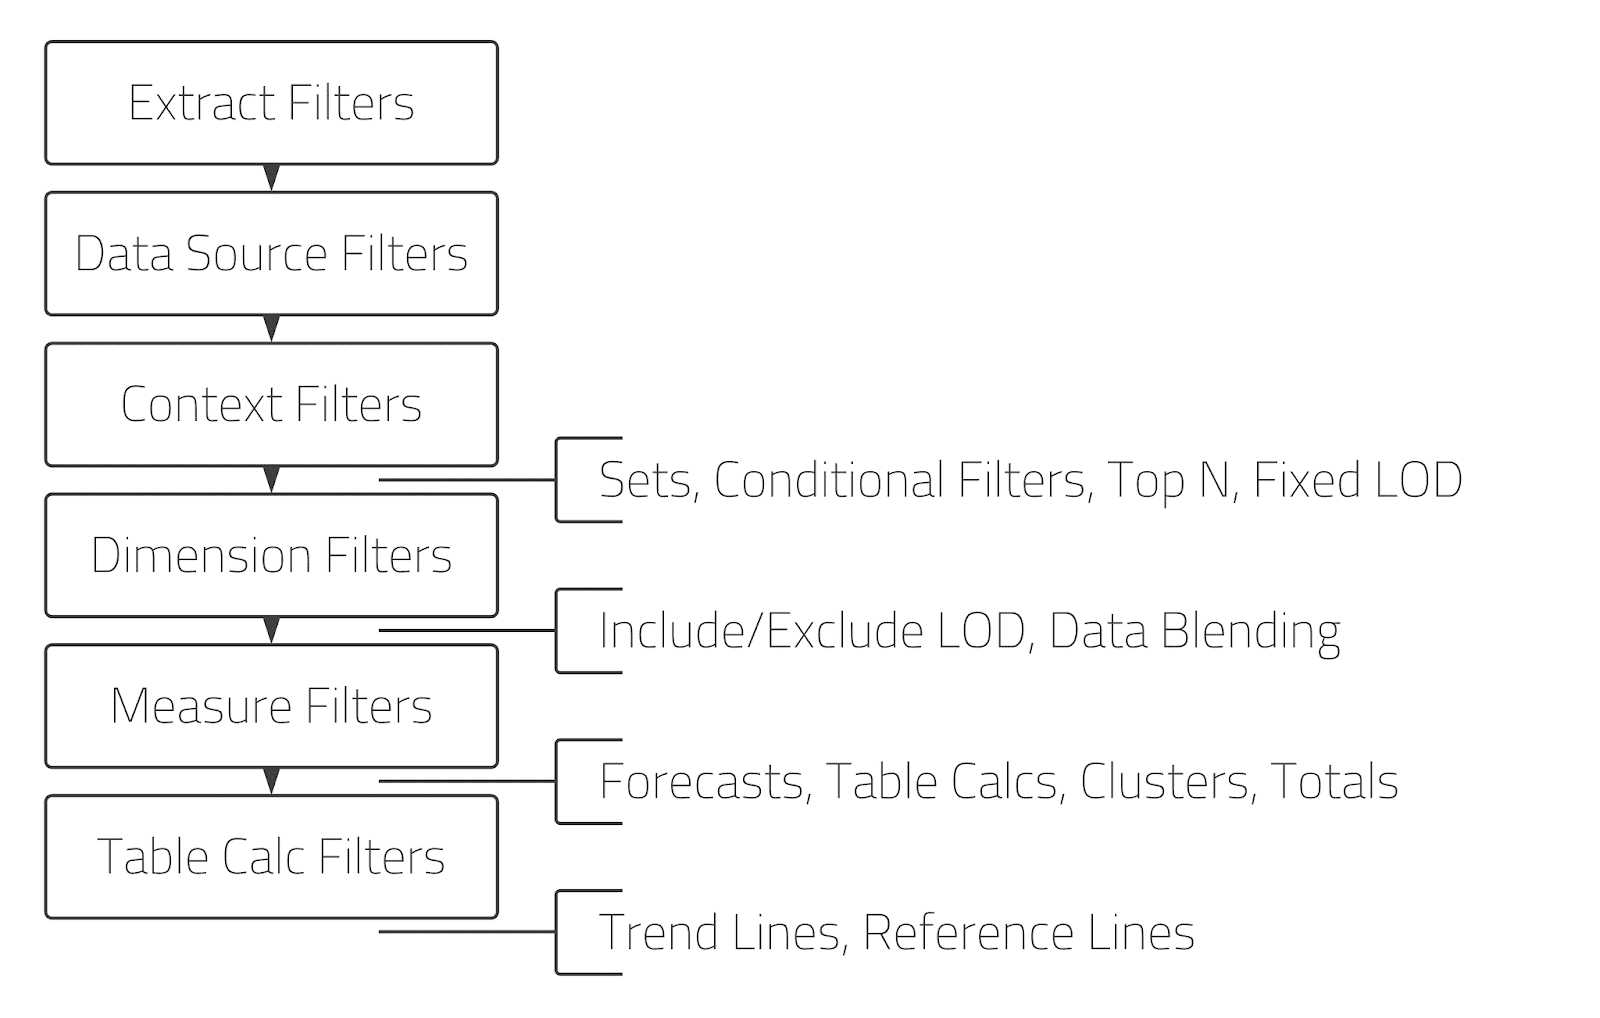
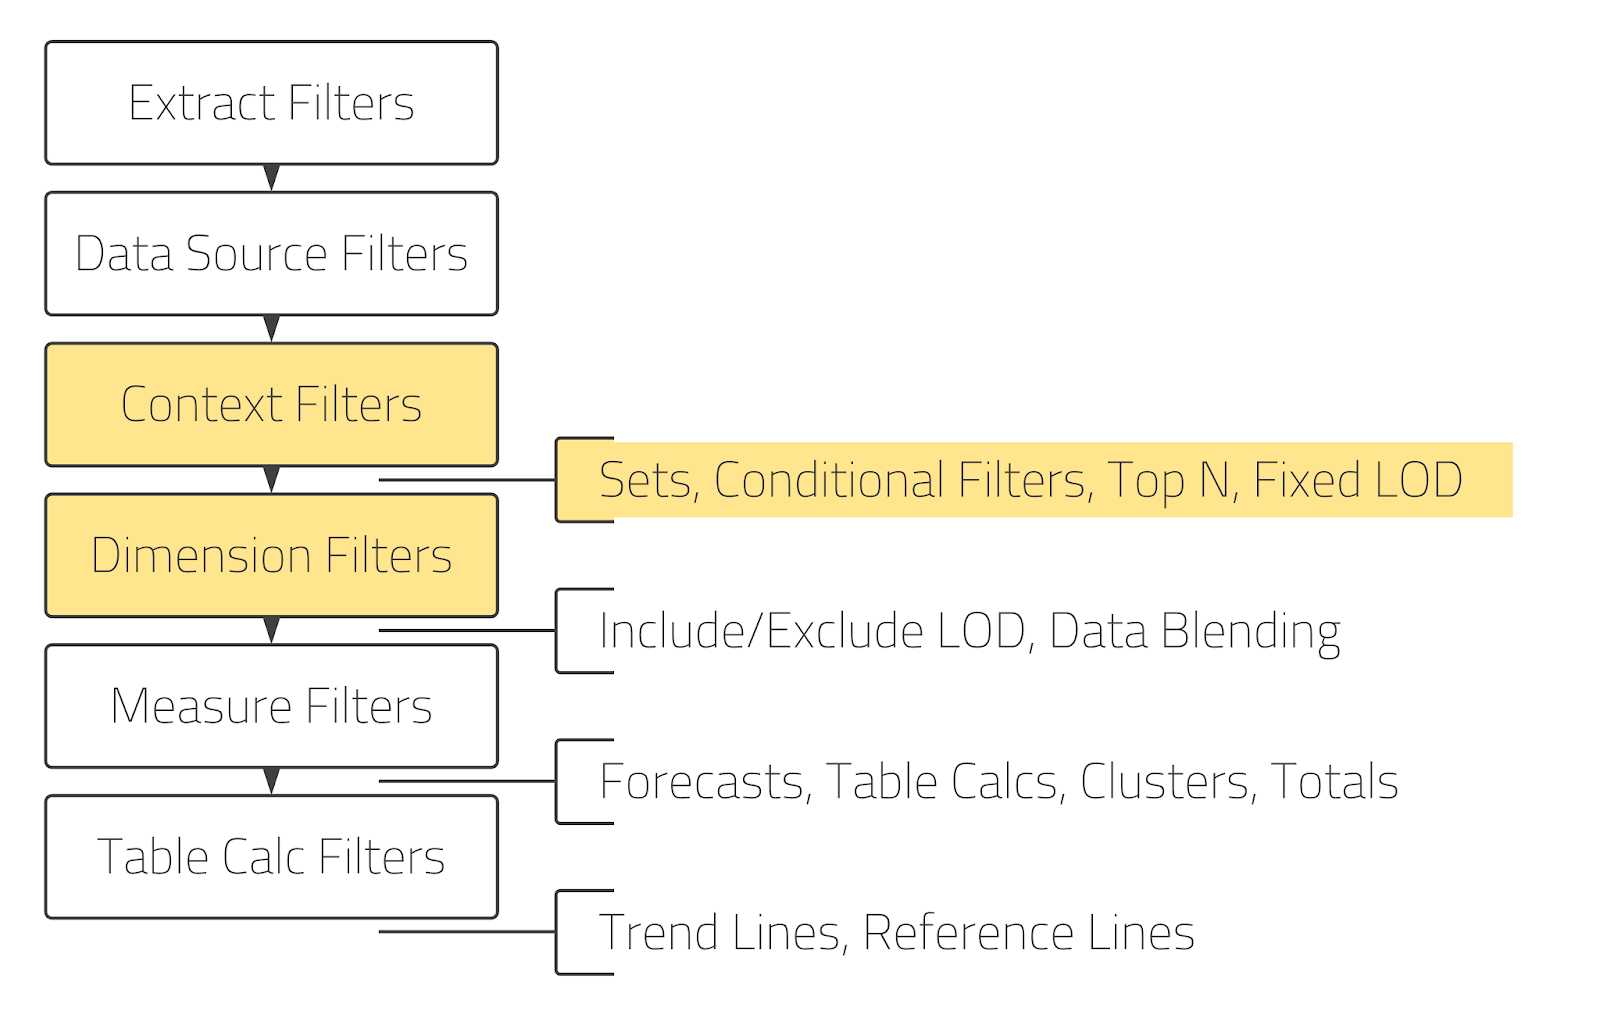
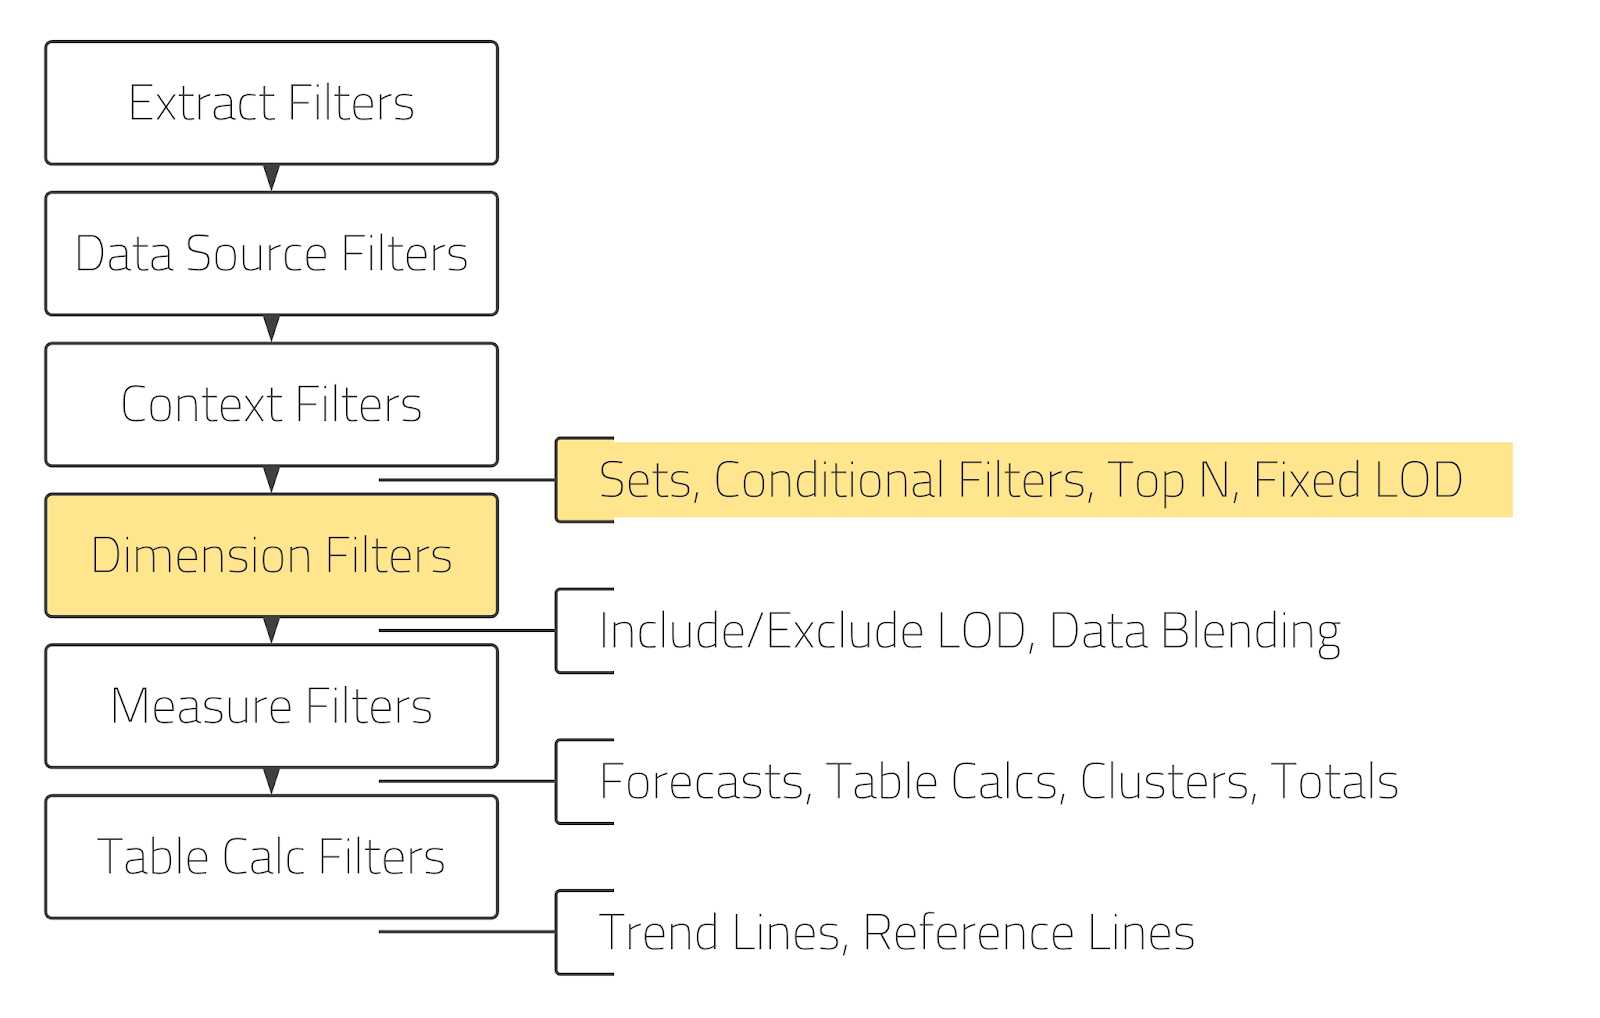
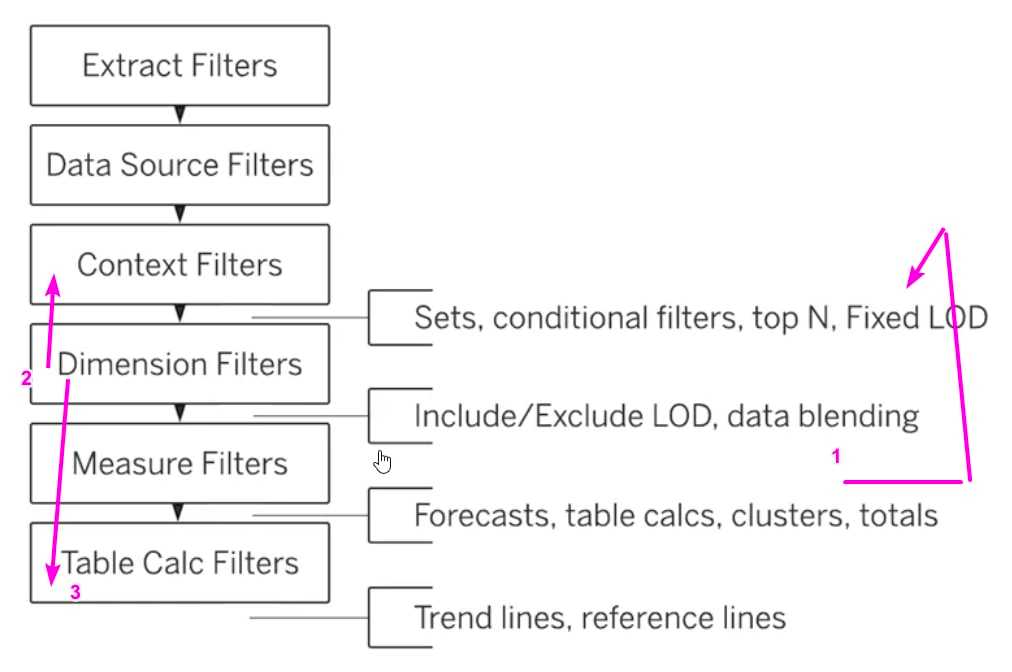
On the left, we can see the main types of filters, and on the right, we can see other types of Tableau functions, such as LOD (level of detail) calculations, table calculations, totals, and reference lines. The order flows from top to bottom. It is important to note that the order of operations does not include all Tableau functions. For example, the Pages bookshelf is not included (if you want Tableau to create a more detailed Operations Order, vote for the following: Enhanced Trading Order documentation). However, even without all the components, the chart is a pretty useful tool for understanding how Tableau works and is particularly useful when you are troubleshooting a problem.
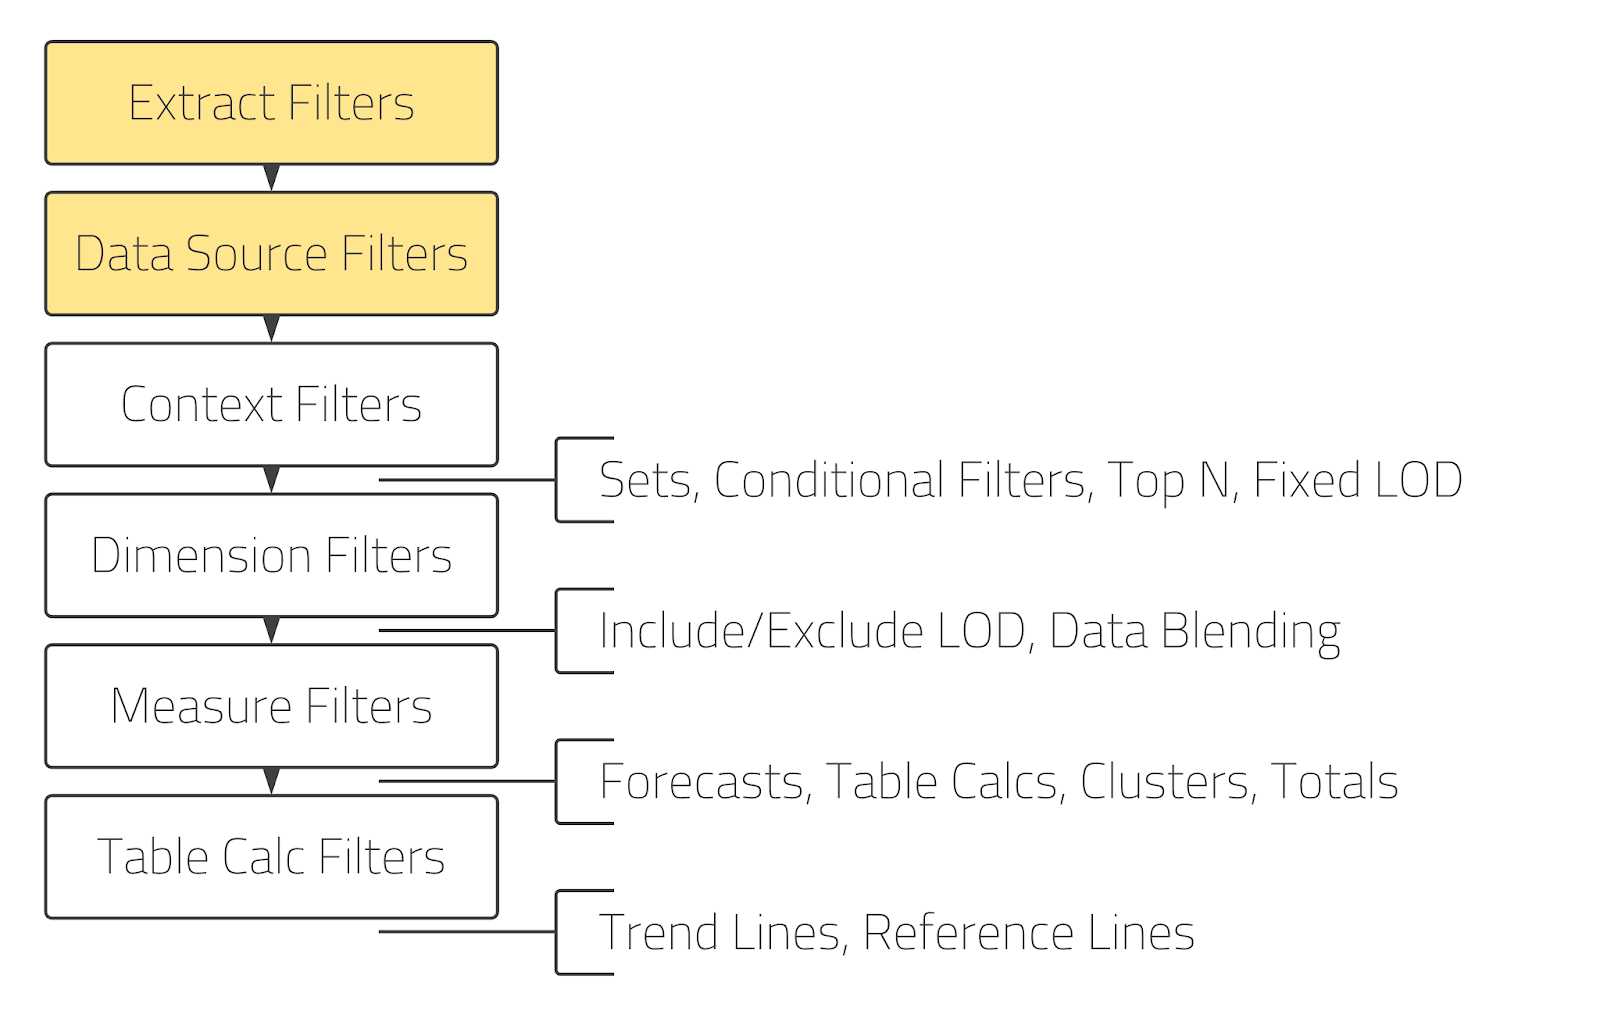
I'm not going to explain each of these features in detail, but let's quickly go through the order. As we can see, the first feature to be calculated is Extraction Filters, followed by Data Source Filters (if you want to know more about the difference between these two filters, check out this great discussion Difference between Extraction Filters and Data Source Filters).
Next in order are Context Filters, followed by Sets, Conditional Filters, Top N Filters, and Level of Detail (LOD) Fixed expressions, followed by Dimension Filters. As we will see in the next section on Common Problems, this is where we often start to see a variety of problems with the order of operations. This is because we need to think carefully about whether we want our filter to be applied before or after things like N Principal and LOD Fixed filters. Those filters that need to compute before should be converted to context filters. Those that need to compute after can remain dimension filters (the default).

Next, we have Level of Detail (LOD) Include/Exclude and Blending. While it might seem that we would have similar problems with Include/Exclude LODs as with Fixed LODs, those problems are much less pronounced, as they are calculated after context filters and dimension filters. Therefore, whether you use a context or dimension filter has little effect on how the Include/Exclude LODs are calculated. That said, as we will see below, we can convert our Fixed LODs into Include/Exclude LODs to cheat the order of operations.
Next, we have the Measurement Filters, which in my experience don't usually cause much trouble with the trading order.
Then we have Forecasts, Table Calculations, Clusters, and Totals, followed by Table Calculation Filters. This is another area where we are starting to run into some trade order problems. As we will see later, this is largely due to the nature of table calculations and how they are calculated.
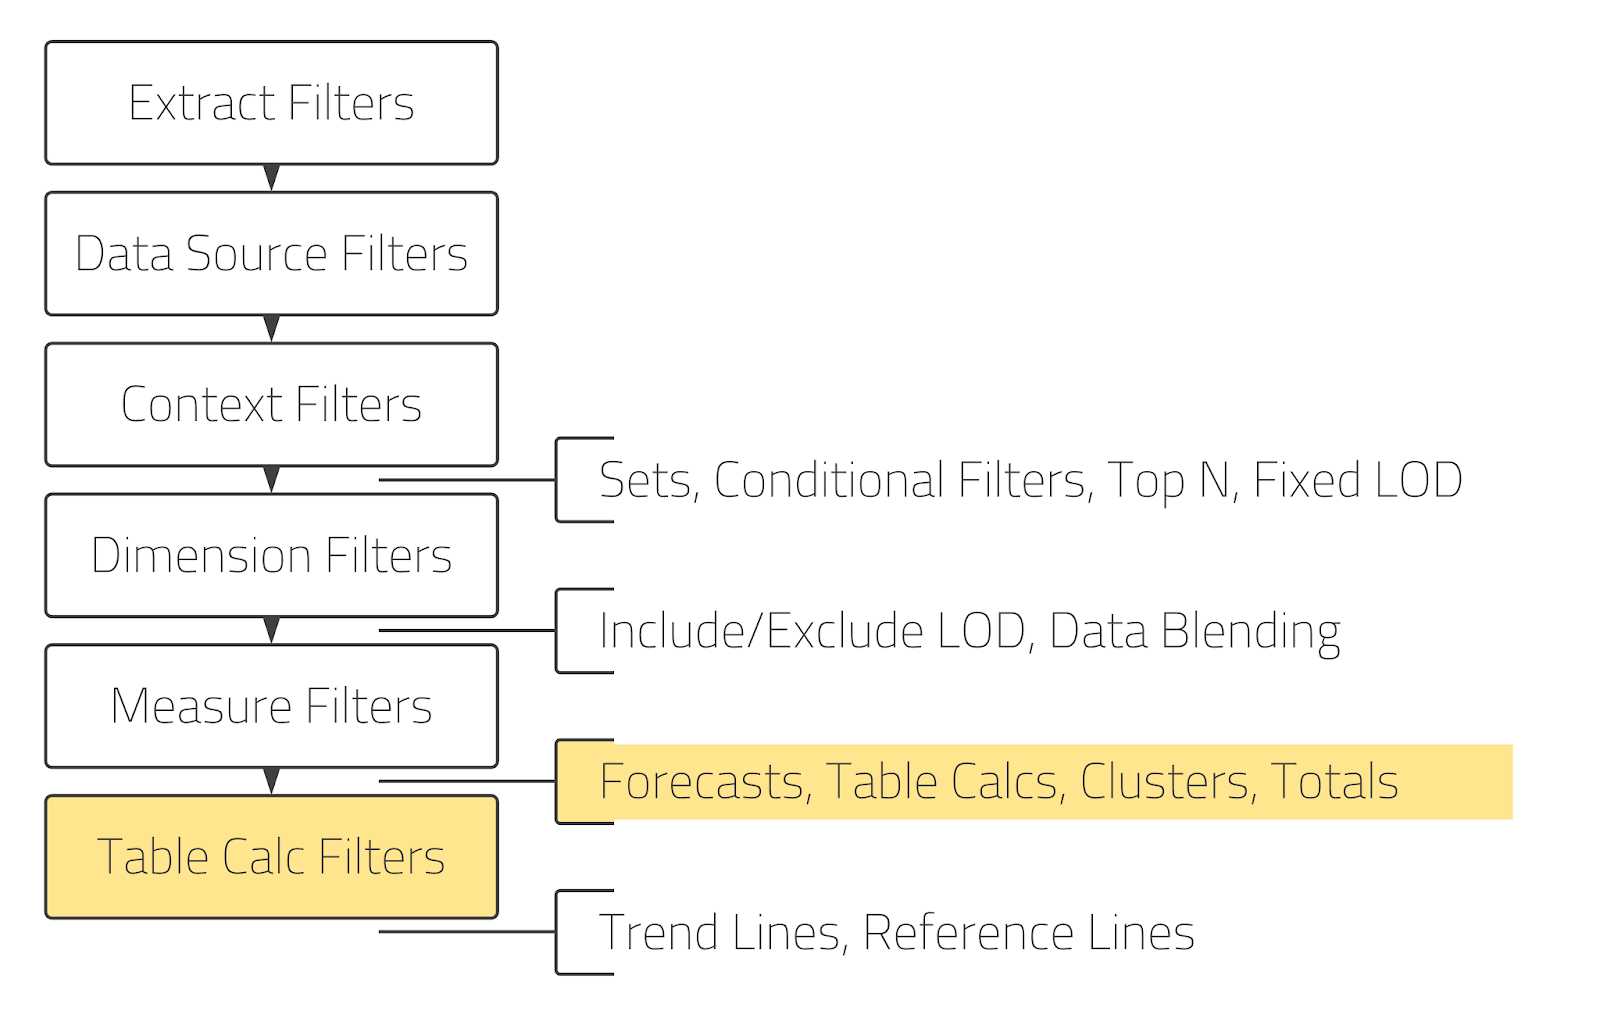
Finally, the last elements in the Trade Order are Trend Lines and Reference Lines. These will always be calculated as the last element.
Common Problems with the Order of Operations in Tableau
Now that we have introduced the Trade Order, let's talk about some of the most common Trade Order problems. To be clear, these are not the only problems you will encounter, but in my experience, they tend to be things we have to deal with on a fairly regular basis.
1) Dimension and Context Filters with LOD Fixed
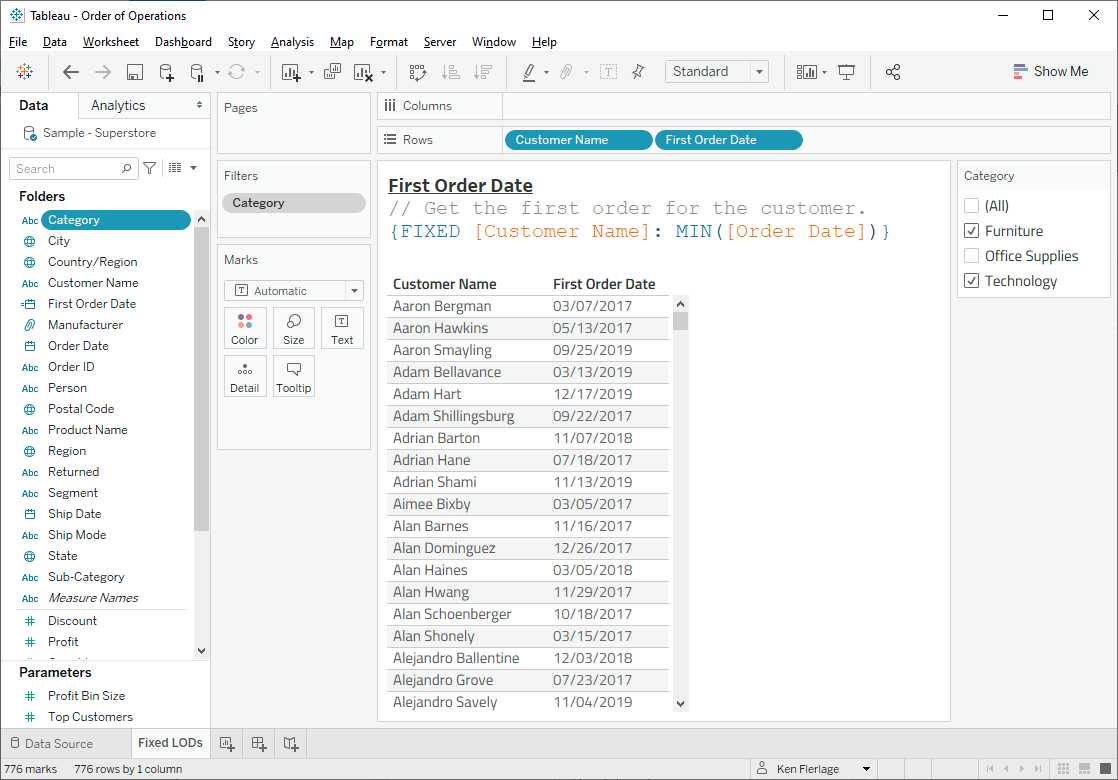
Let's start with an example with Tableau's sample data "Superstore". We have a list of customers where some of them have placed several orders and we want to know the date of the first order of each customer. To do this, we first create a level of detail expression (LOD) Fixed with which we can get the date of the first order.
First Order Date
// Get the first order for the customer.
{FIXED [Customer Name]: MIN([Order Date])}
We then create a view that shows each customer with the date of their first order.
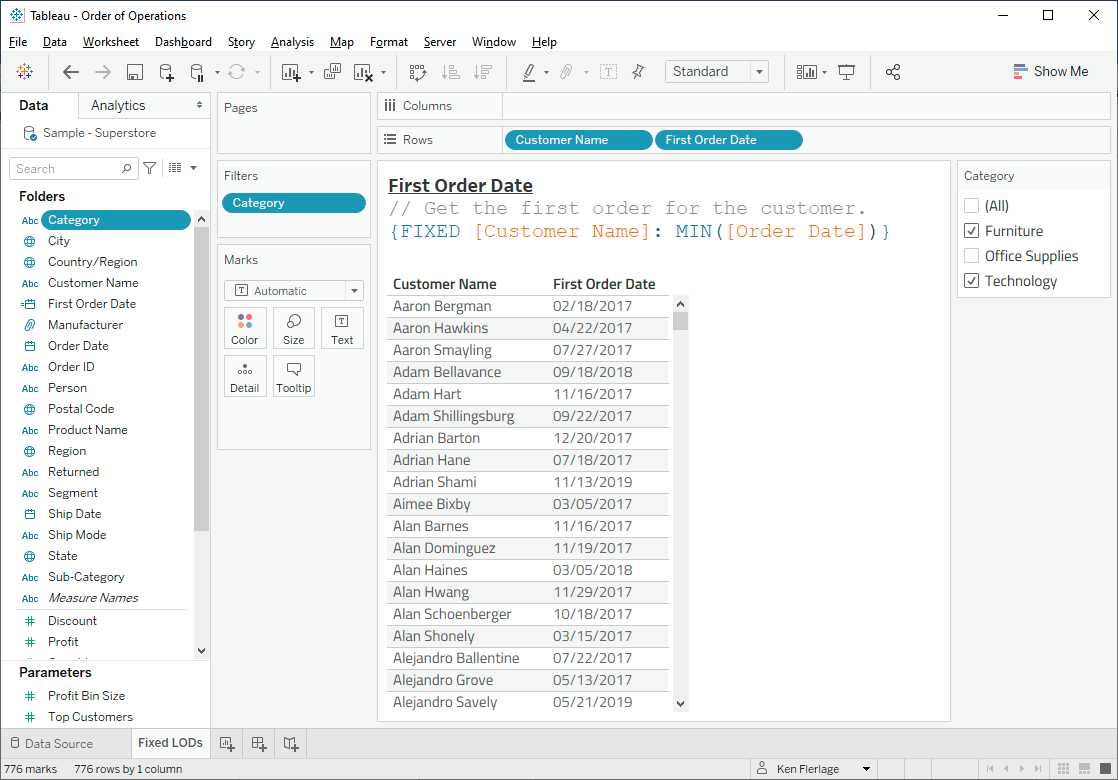
This works very well, but what happens if you want to apply some filters? For example, let's filter by Category and select only Furniture and Technology.

You would expect Tableau to show us the dates of the first order for those two categories only, but as you can see above, the dates remain unchanged.
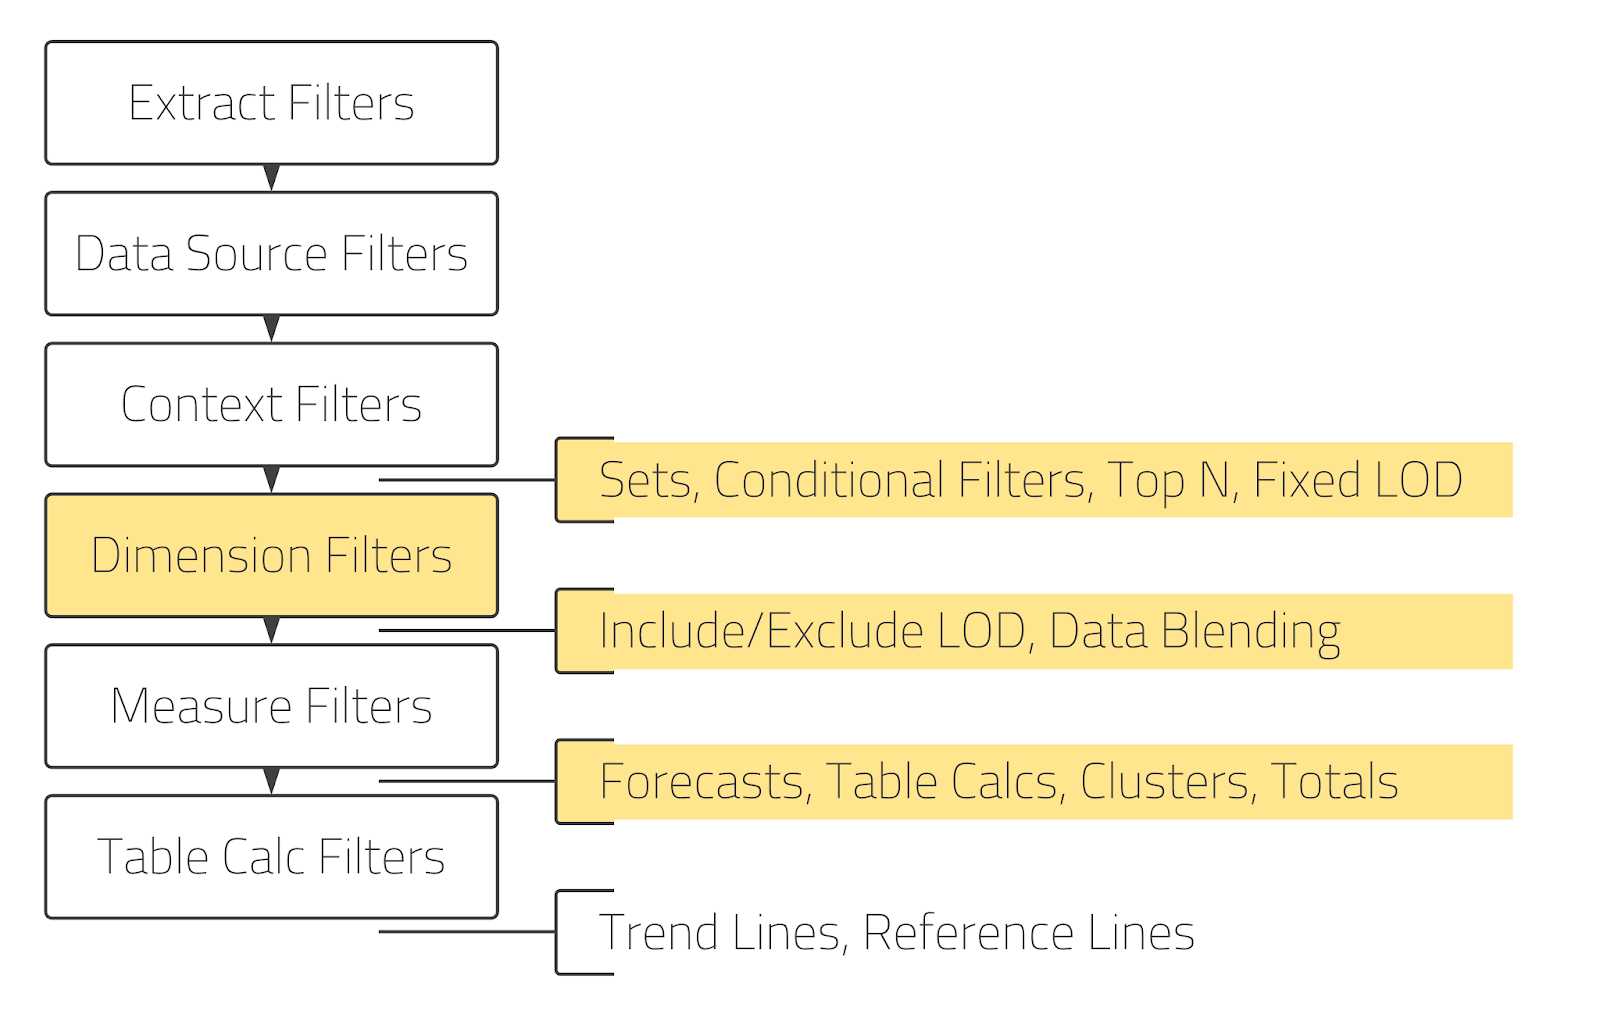
So what's going on here? Let's break it down in terms of the order of operations. We have a Dimension Filter on Category and we have an LOD Fixed expression.

As we can see, the LOD Fixed comes before the dimension filter. Therefore, the LOD is calculated first, finding the general date of the first order for each customer. Only after Tableau has calculated the date of the first order, it filters the view. That is why the dates do not change. To be clear, the dimension filter is not totally useless in this case but will eliminate any customer who has not bought any furniture or technology. The problem is that it simply won't have any impact on the dates.
If we want to force the filter calculation before the LOD, we need to change it to a context filter. We can do this by right clicking on the filter and choosing "Add to context". You will notice the difference visually as context filters are shown as grey pills.
As it is now a context filter, it will be calculated before the LOD, so the First Order Date values change.
This is, in my opinion, probably the most common order of operations problem, so it's really important to understand how dimension and context filters work with Fixed LOD.
2) Fixed, Exclude, and Include LOD... Oh my God!!!
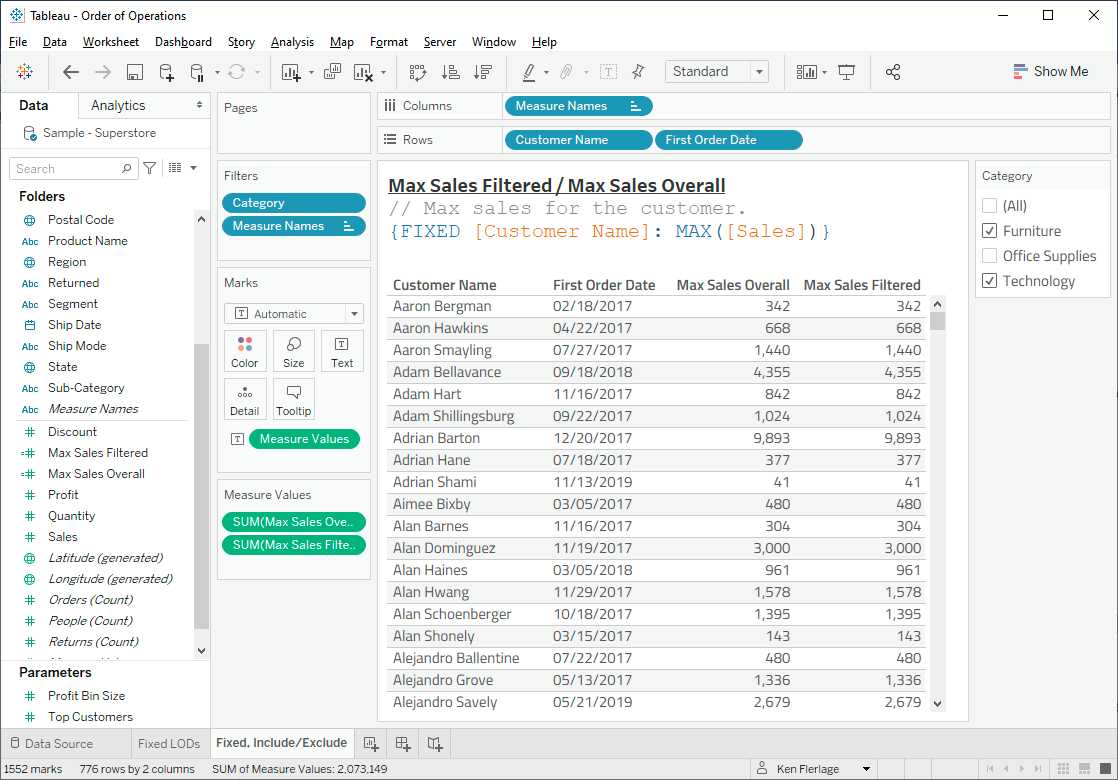
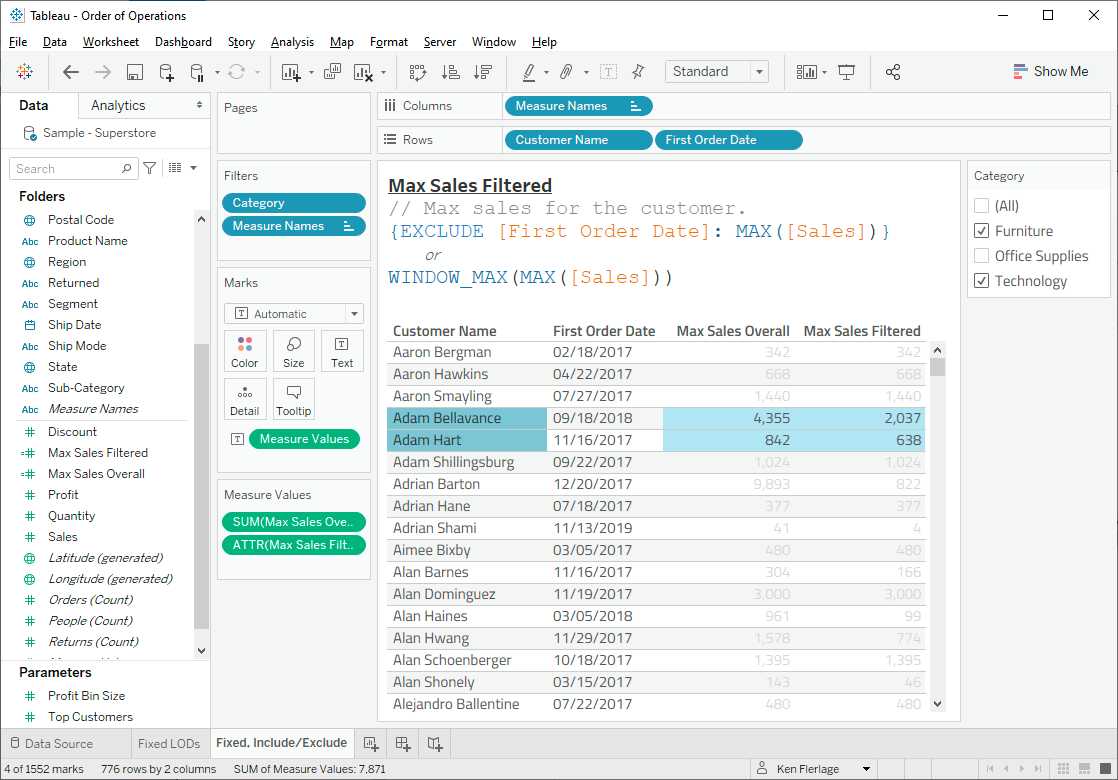
Sometimes you may find yourself in a situation where you need a single filter to calculate before one LOD but after another. Essentially, you need this filter to act as a context filter in some cases and a dimension filter in others. Unfortunately, a filter can only be one or the other, so we will find ourselves in an Order of Operations predicament. For example, let's take our view from above and add one more requirement. We want to compare the maximum sales for each customer for the selected categories (based on the filter) with the maximum sales for all categories. Both calculated fields will use the same LOD:
Max Sales Filtered
// Max sales for the customer.
{FIXED [Customer Name]: MAX([Sales])}

Max Sales Overall
// Max sales for the customer.
{FIXED [Customer Name]: MAX([Sales])}
However, we want the category filter to be calculated before Maximum Sales - Filtering, but after Maximum Sales - All. This is simply not possible because, as we pointed out earlier, a filter cannot be both a dimension filter and a context filter.
So how do we address this need? Well, first of all, we will need to change the context filter to a dimension filter because there are no LOD types that can be calculated before context filters. Now that our filter is a dimension filter, both LODs will be calculated before the filter, giving us the same values.
But we need to find a way to move Maximum Sales - Filtering in the Trade Order so it calculates the filter afterwards. We can do this in two ways. We can either change the calculation to use an Include or Exclude LOD or we can change it to use a Table Calculation since all these compute after dimension filters.
Here is an LOD Exclude that should work:
Max Sales Filtered
// Max sales for the customer (Exclude LOD).
{EXCLUDE [First Order Date]: MAX([Sales])}
And the table calculation would look like this:
Max Sales Filtered
// Max sales for the customer (table calculation)
WINDOW_MAX(MAX([Sales]))
While some of the filtered maximum sales will match the total maximum sales (because the maximum sales for these customers were for Furniture or Technology), we can see some cases where they differ, indicating that our calculations worked.
3) Dimension and Context Filters with N Principal Filters
In issue 1, we addressed problems with dimension filters, context filters and LOD Fixed. The third problem we will address is similar, but deals with Top N filters instead of LOD Fixed expressions.
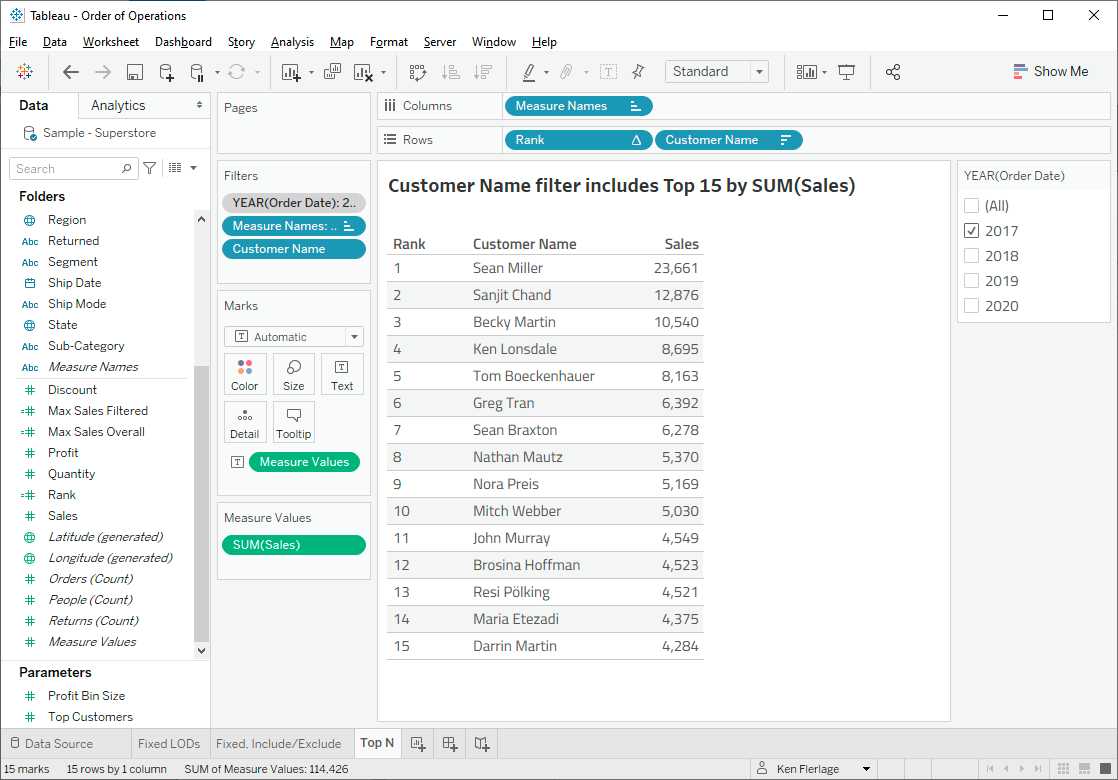
For this example, we will create a view that shows the top 15 customers by sales. We have done this by creating a Top N filter by dragging the customer name into the Filters part. We also have a dimension filter on the year of the order date.
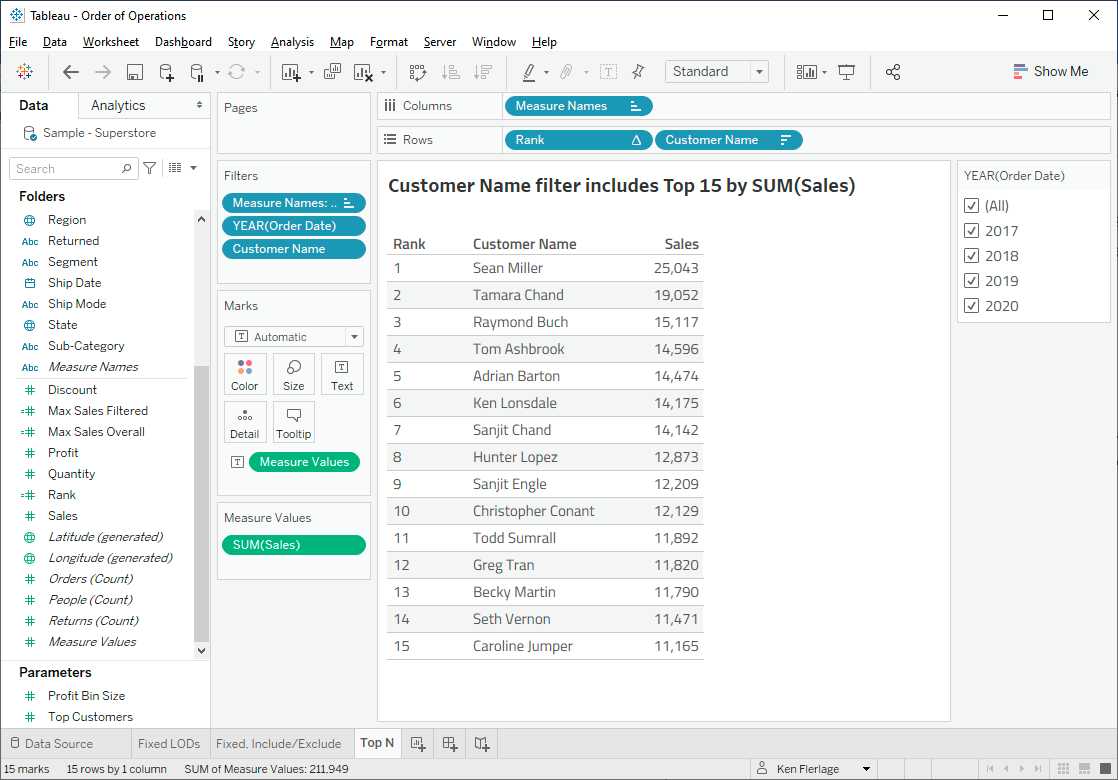
In this case, our Sales value is just a normal aggregation; we're not using any LODs, so they're out of the picture.
This works very well - we can see our top 15 customers very simply. The problem comes when we select just 2017, our N Top filter seems to break as we now only have the top 12.
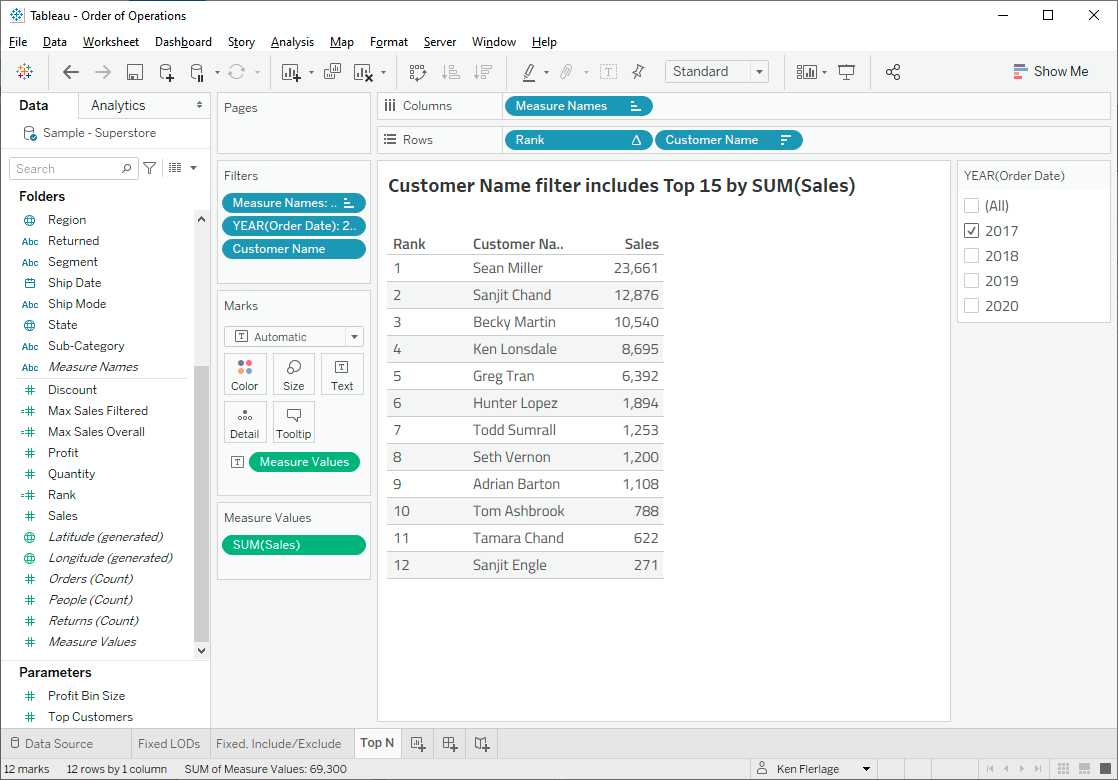
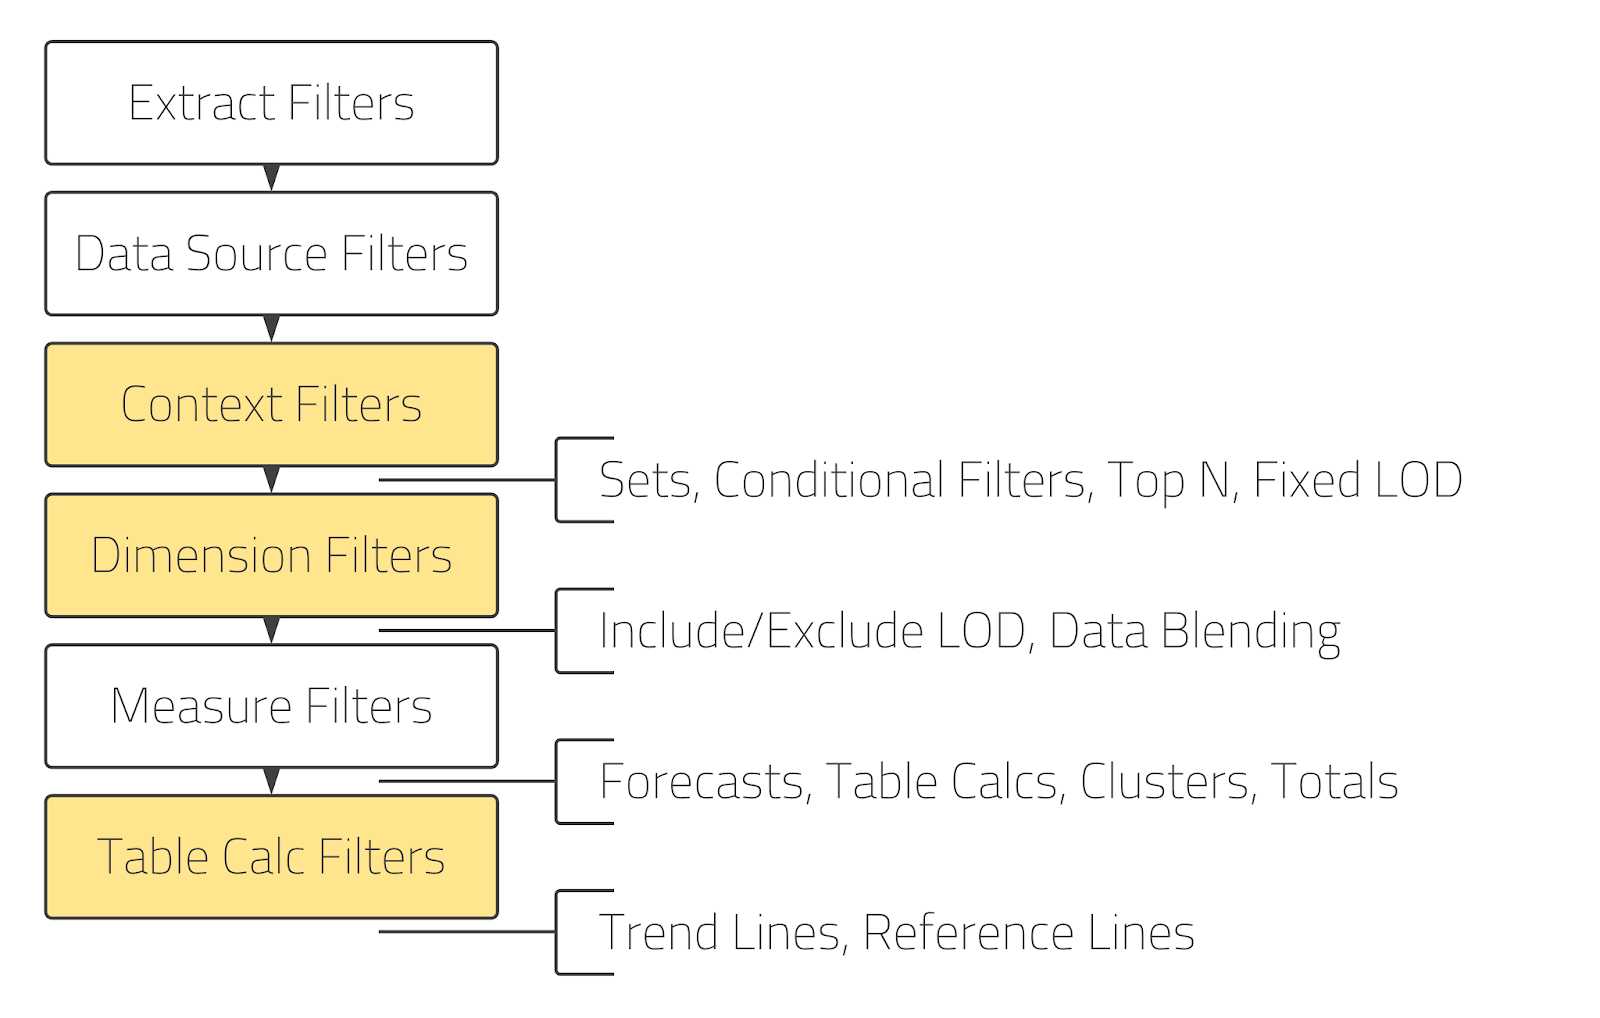
So what is going on here? Again, let's look at the order of operations and break it down. We have a Top N filter and a Dimension Filter as shown below.
But, as we can see, the N Principals filter calculates before the dimension filter. So, Tableau is first getting the overall top 15 of the whole set information. Once it calculates the top 15, it applies the Year filter. In this case, 3 of our top 15 had no sales in 2017, so they are removed from view, leaving us with only 12.
If we want to ensure that our Top N filter calculates after our Year filter, then the solution is the same as in #1. We simply add the Year filter to the context.
Note: It is possible to add an N Main filter to the context, by converting it into a context filter and an N Main filter. In this case, it will be computed as a context filter, before LOD Fixed, other N Main filters, etc.
4) Index vs N Main
This is not so much a problem as something I would like to point out. I often see people using INDEX to display N Principals. To use the example in #3, we could create a calculated INDEX() field and then use it as a filter, keeping the values 1-15.

In this case, it would not matter whether the Year filter is a context filter or a dimension filter (Note: This may affect performance, but will not affect functionality). This is because the INDEX filter is a table calculation filter, which is calculated near the end of the Order of Operations only ahead of trend or reference lines.
So when should I use an N Main filter versus INDEX? As is almost always the case, it depends-on what other types of filters and features are being used in your view, when you want the filter to be computed, etc. My general recommendation is to use an N Principal filter as the default as these tend to be simpler and don't come with the inherent complexities of table calculations. But, when needed, INDEX can be a great option to perform an N Principal filter.
5) Table Calculations and Table Calculation Filters
While we're on the subject of table calculations, my last common Order of Operations problem will deal with these beasts. For this example, I've created a worksheet that ranks each city/state by sales using a simple RANK calculation.
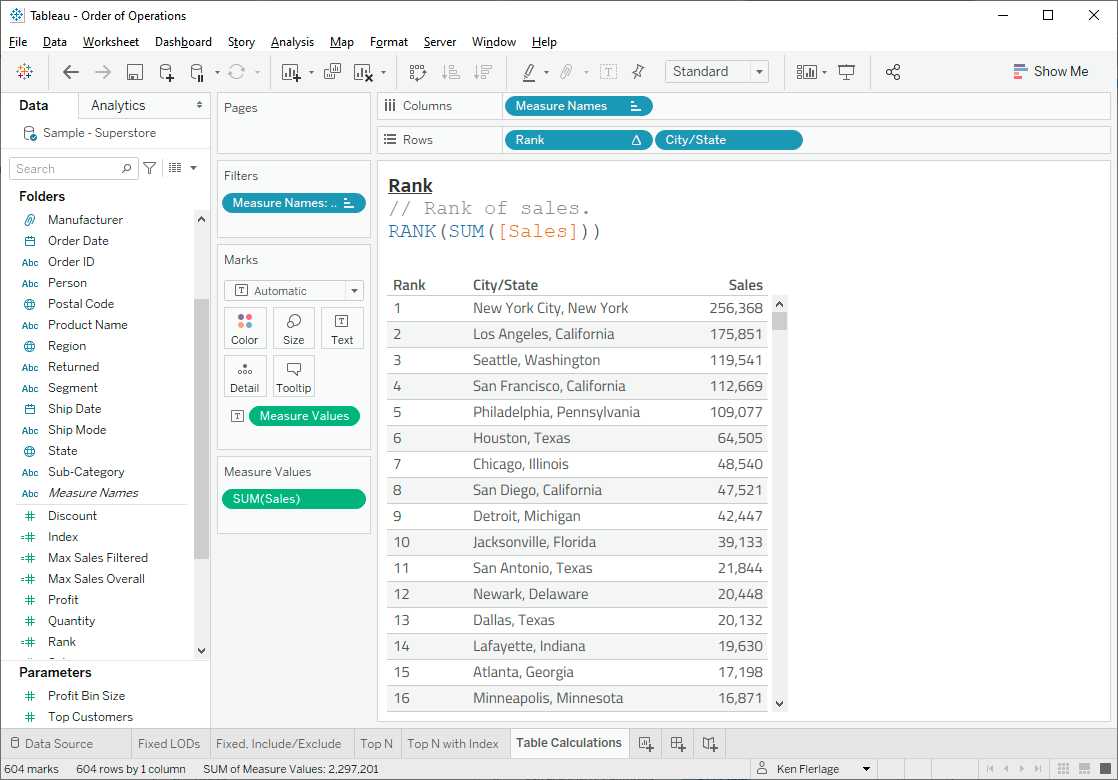
What we want is to be able to filter this by state, but still see the national ranks. If we simply filter by State, then the rank is recalculated as shown below.
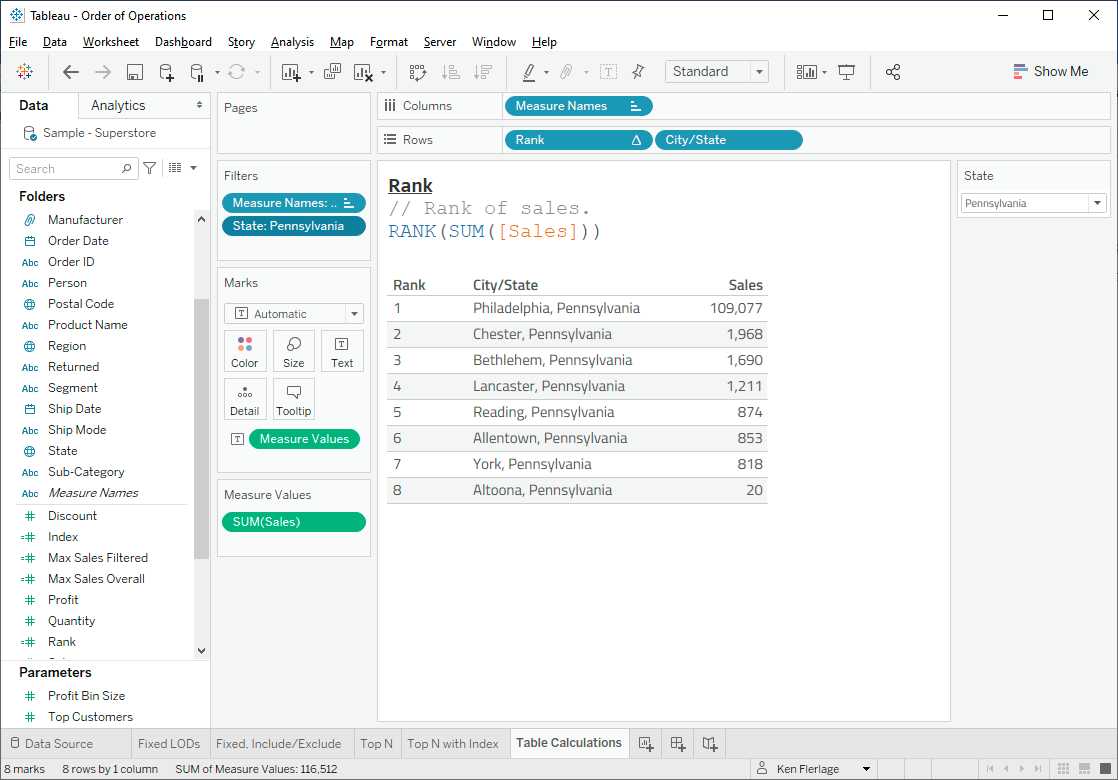
This, of course, is due to the order of operations.
The table calculations are calculated after the dimension filters, so the view is filtered first and then the rank is calculated. So how do we make sure that we preserve the original overall sorting, while filtering the view? To do this, we need the state filter to be calculated after the table calculation. And the only filter that is calculated after the table calculations are the table calculation filters. So, if we can somehow force our state filter to be a table calculation filter, this should work. To do this, we can use a trick I learned from the amazing Pooja Gandhi. We can use LOOKUP with an offset of 0 as shown below.
State TC
// Force state to be a table calc...
// ...so it will compute after the Rank.
LOOKUP(MAX([State]), 0)
Then we can use this as our filter.
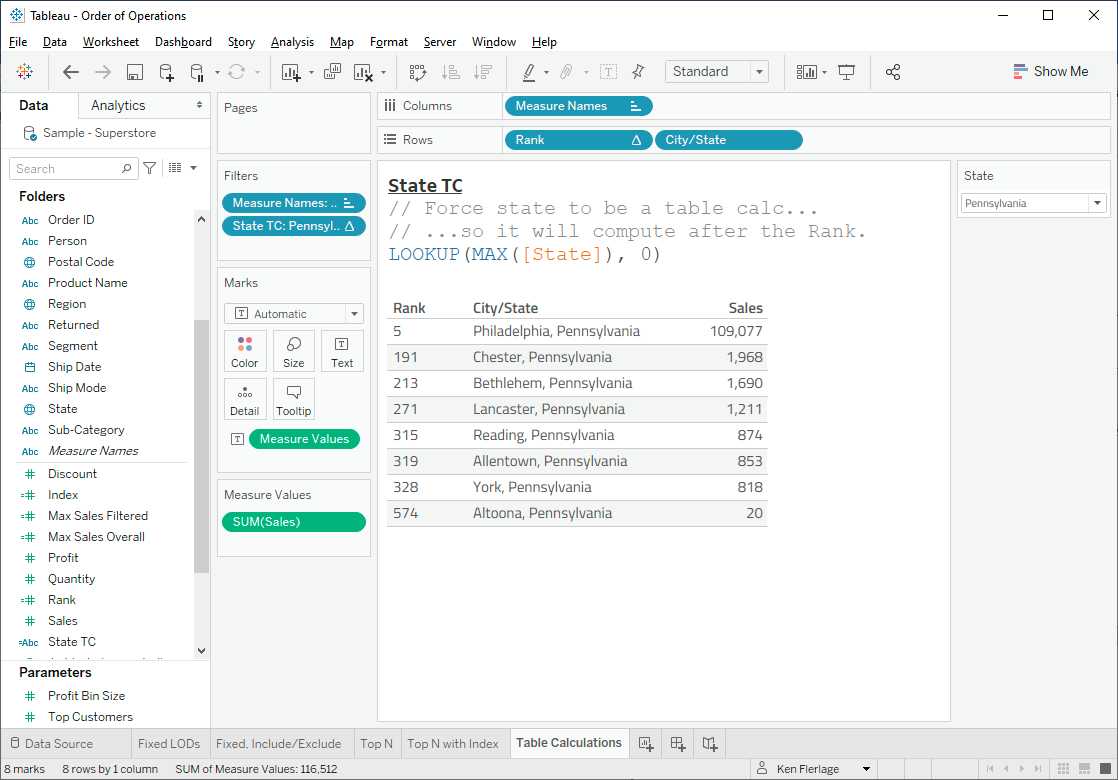
Because the table calculation filters are calculated after the table calculations, the ranking is calculated first and then the view is filtered, allowing us to keep the overall ranking for each city.
Tableau order of operations: another example
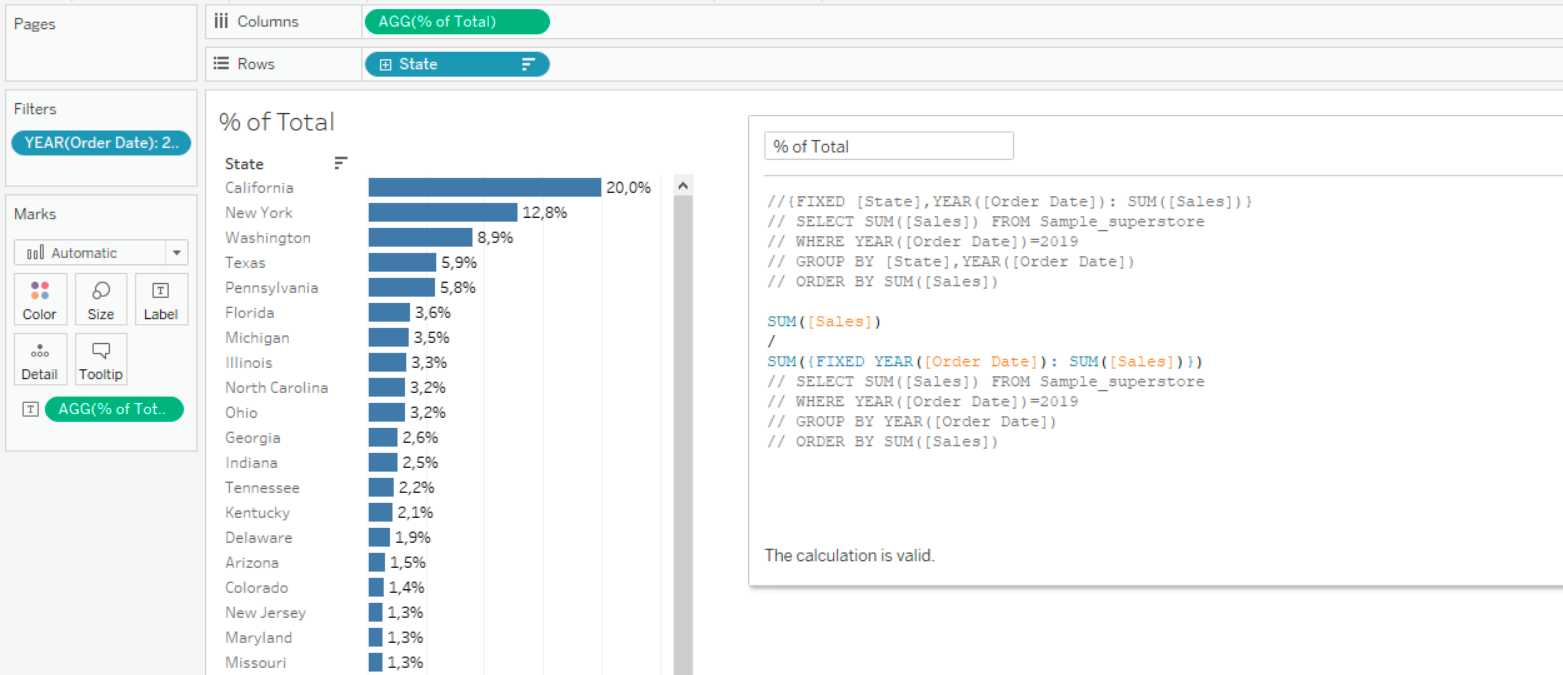
Suppose that we want to calculate for each state the percentage of sales of the total with LOD (of course, that would be better to do tables calculations, this is purely a learning curve). I did it using this formula:
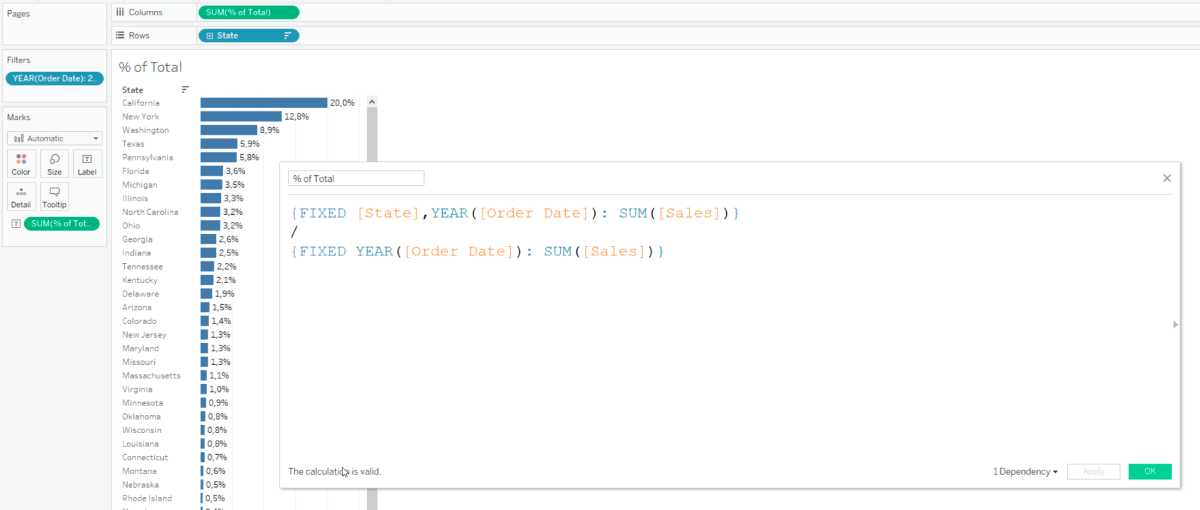
And in general it works correctly, but it is too complicated - we use two LODs instead of one. So how do we know if the formula in the numerator is redundant?
First, let's figure out what SQL query was sent by Tableau when we just put together a sheet with the amount of sales by state. When we put any pills on the shelf Tableau generates a query to the database, gets back an aggregate table of data and visualizes it. If we put pills as on screenshot, tableau sends this query (don't blame me for notation, I have paws on SQL, now it's more important the sense). This, by the way, is called VIZQL - Tableau's proprietary technology for turning pills into database queries.
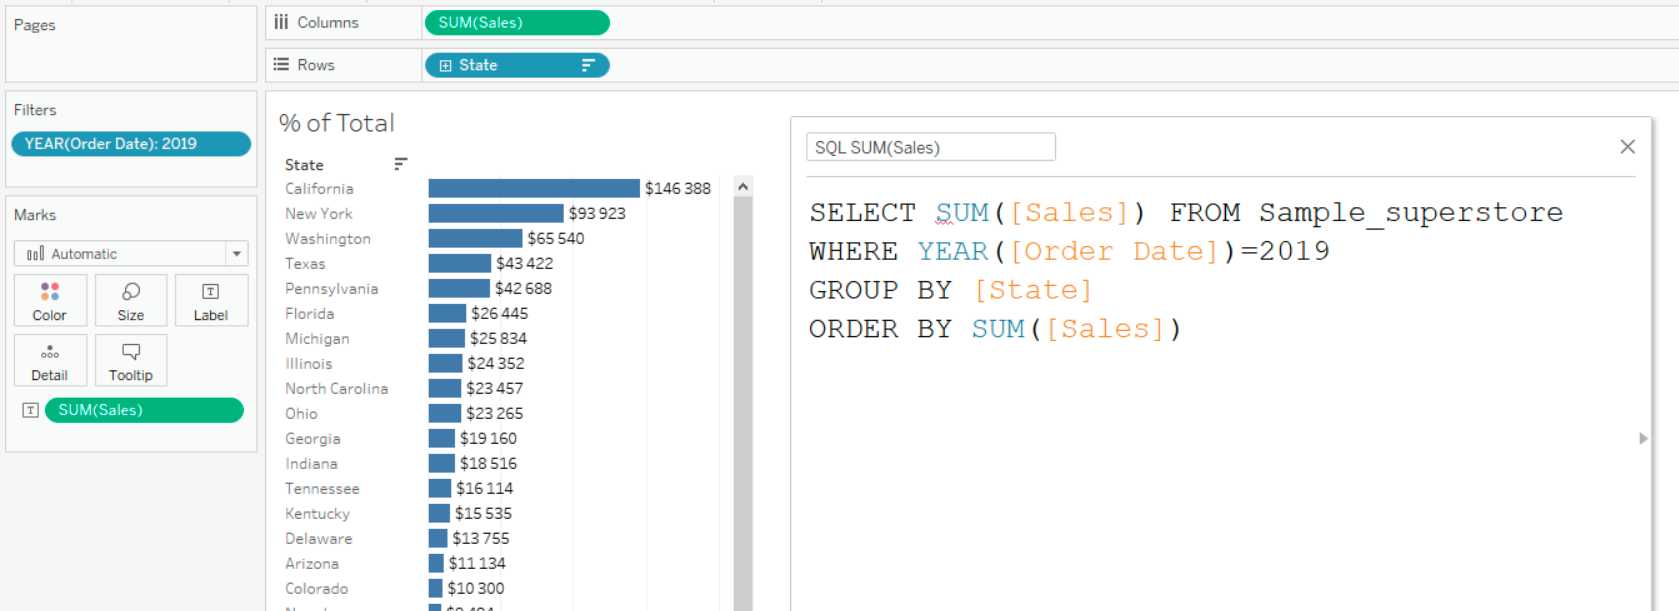
Now let's understand how LOD (in this case FIXED) works. Level of Detail calculation, it's such calculation, that creates separate subquery to database and then joins it to that aggregated table, which was received as a result of VIZQL sheet query. That is this query is executed parallel to main one and then it's Join. Because of this LODs are so slow and work on large amount of data.
Structure of LOD expression looks like this:
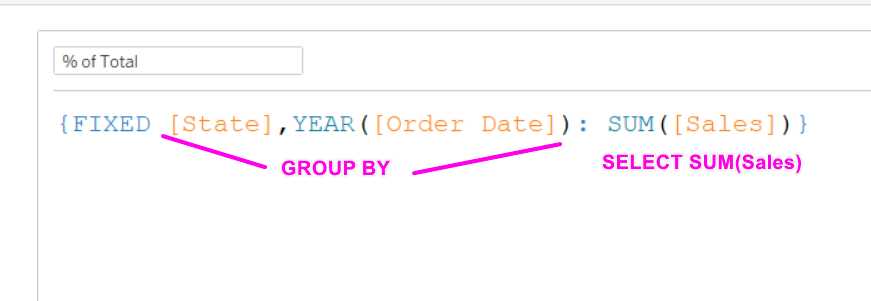
It turns out that our formula calculating the percentage of the total will turn into such subqueries:
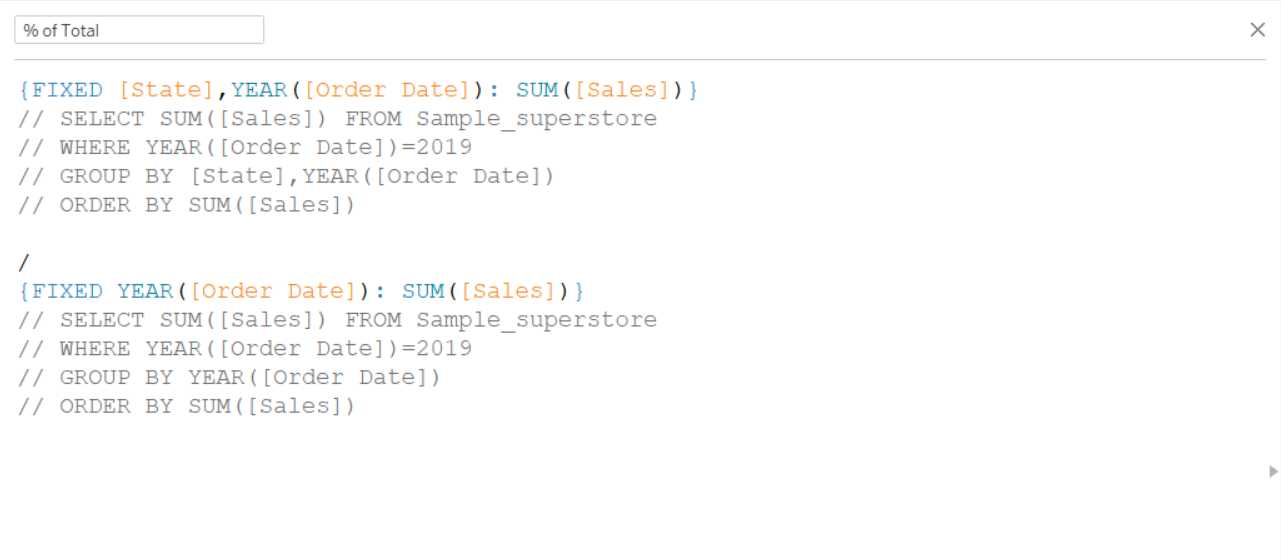
We can immediately see that the first subquery is essentially identical to the query that generates the sheet itself, without using LOD. In this case, it turns out that we overcomplicate and instead of LOD we can use just SUM([Sales]) in numerator. But in this case Tableau will complain that we are mixing aggregated and non-aggregated figures:
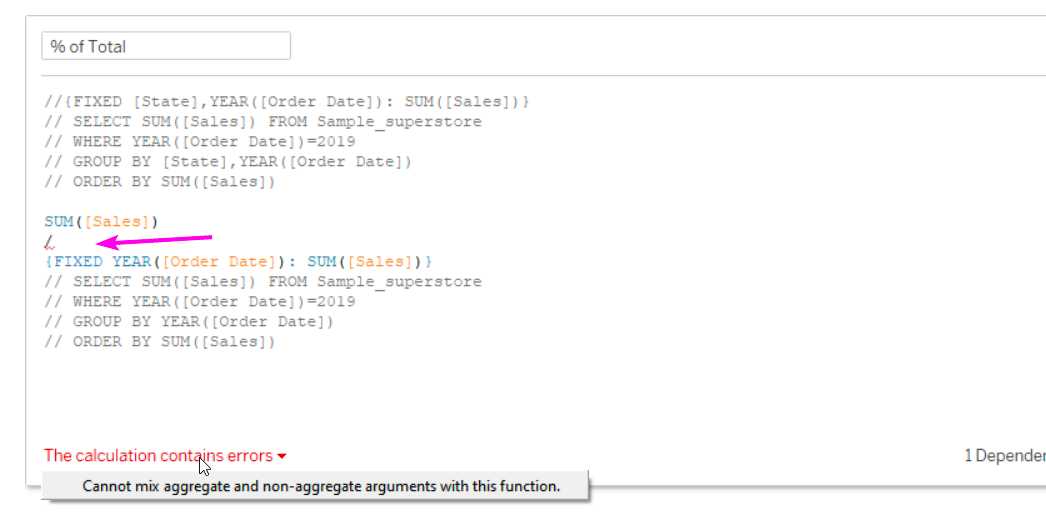
To get rid of this error we need to wrap the formula in the denominator in aggregation. For example, into a sum. Everything works perfectly.
Bottom line - when checking your calculations, think about what aggregates you are already getting from the data when you use pills. You don't need to use an LOD with the same granularity, you can just use an aggregation function.
More about Tableau Order of operations
The order of operations of Tableau is an important concept that I think is often overcomplicated. In general, it's imperative to understand it, so you know how data is transformed in Tableau. This will save you from errors in calculating TopN, sets or help to optimise the book, e.g. by using filters on the data source side. However, of the practical cases where we can manage and change the order of operations, I will highlight three main ones:
- Turning a normal calculation into FIXED, so that the calculation "ignores" the filters in the visualisation
- Turning a regular filter into a context filter, so that it acts on FIXED calculations and TopN calculations
- Using Table Calcs filters to filter data out of the view without removing it from the aggregate table.
Let's look at examples for each of the cases.
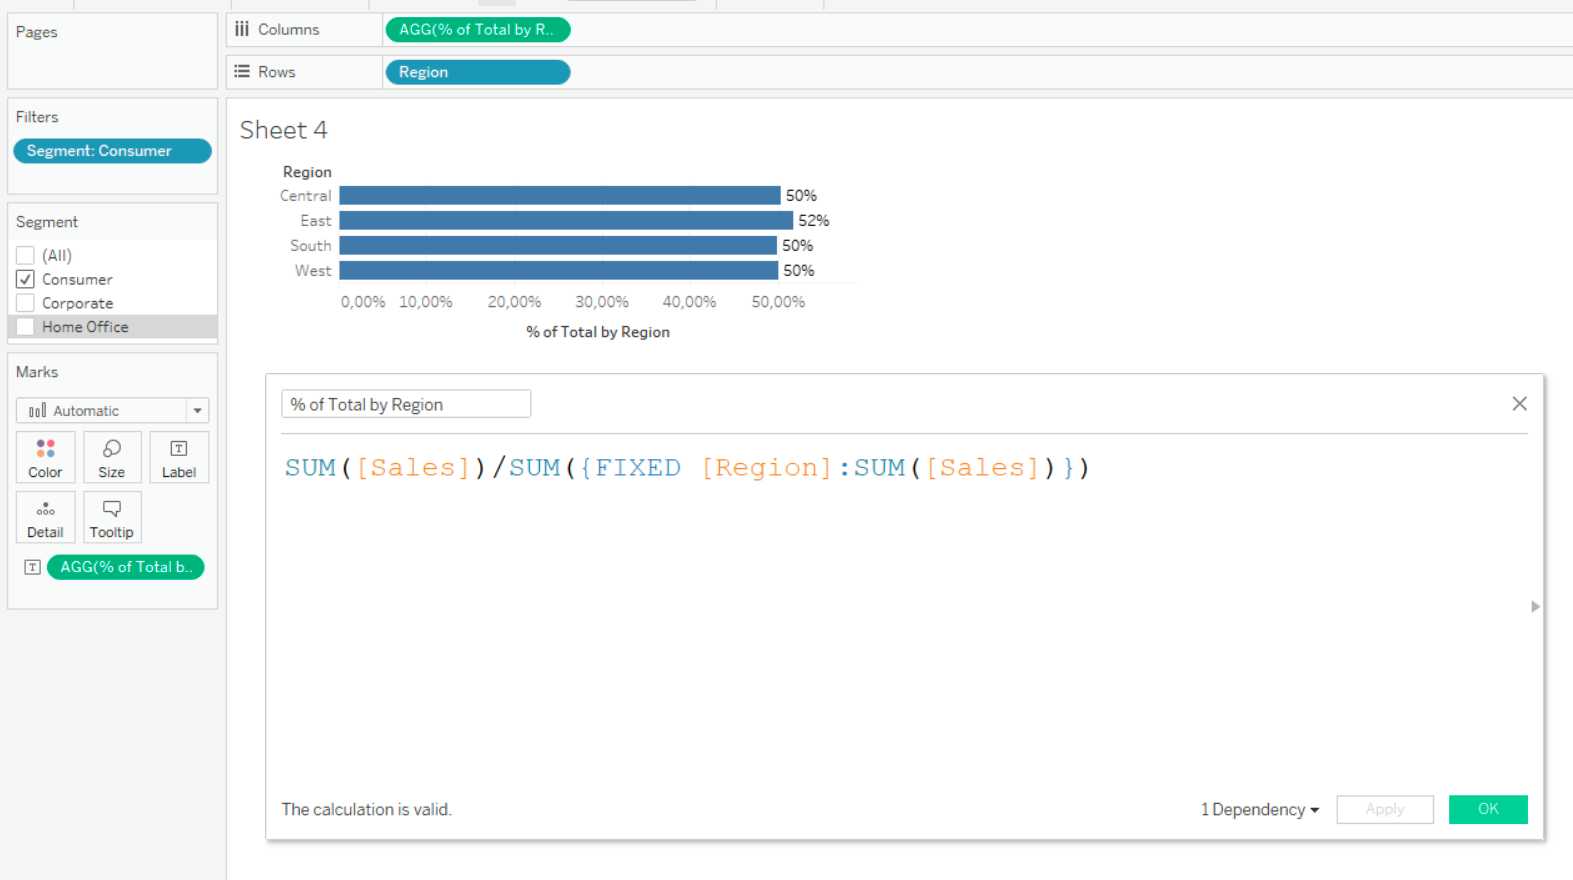
1. Turning a normal calculation into FIXED
Here it's usually super obvious, we want to compute something that will "ignore" the filters. Ignore in quotes, since this query is actually executed in parallel. Business example - we want to see what percentage of sales it makes in the region when selecting a particular product segment in the filter:
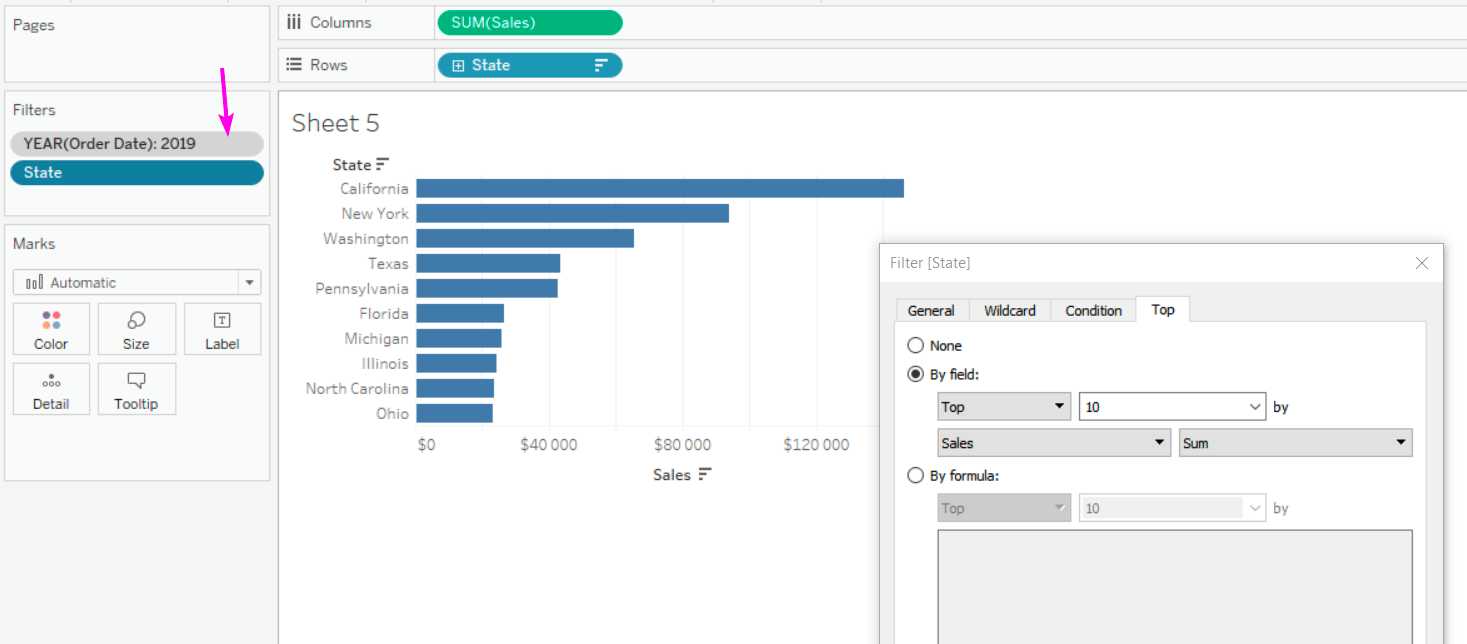
2. Contextual filter
Turning a filter into a contextual filter allows us to apply it "as if at datasource level". This actually creates a temporary table that is already being called by VIZQL, which can both slow down and sometimes speed up the operation of Tableau. If you apply context filter to all sheets in visualisation, think about transferring it to datasource filters via parameters. Business example - we want to see the top 10 states by sales for 2019. We use TopN filter for that, and for it to work correctly when selecting the year, we put the filter by year into context.
3. Using Table Calcs filters
Most often we need LOOKUP functions to make increment calculations work correctly. If we filter with dimensional filters, the data is filtered out and Tableau does not build increments. Business example - we want to show the current year against the previous year, but we also want to hide the first year.
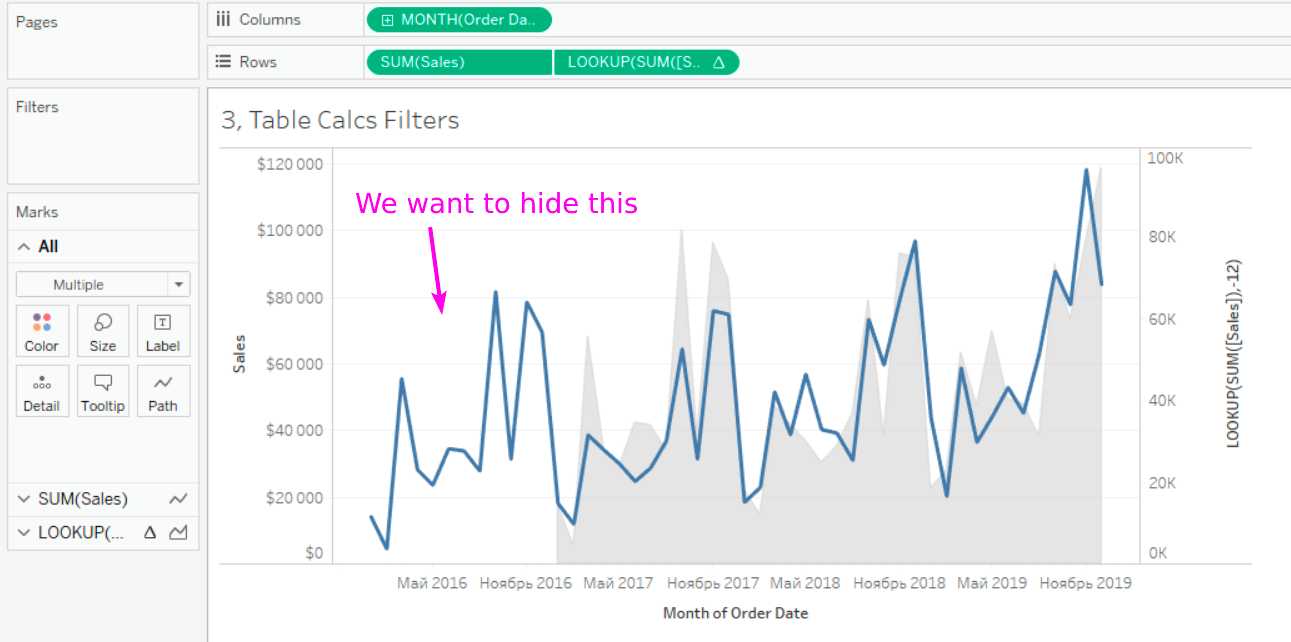
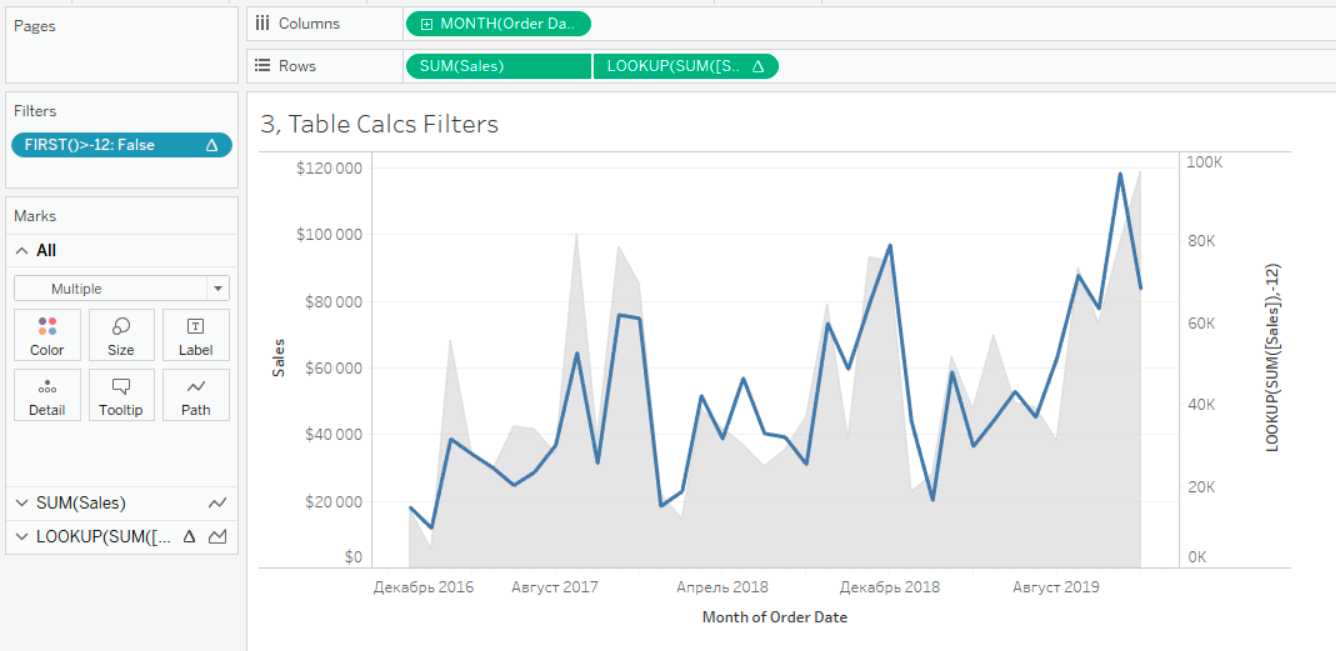
To do this, you can use the filter by FIRST()>-12. Since it is a table filter, it is at the very end of filtering by order of operations. So it will not remove data from the query, but only hide it from view, which is what we need.
I understand that I gave examples without detailed explanations, but it's short and basic cases. If you need to pump up this part, search on the Internet for Tableau Order of Operations. Here, for example, is a good video.